
Parallel and High Performance Computing
High performance computing features in PSCAD allow simulations to be run in parallel over multiple computer cores, resulting in significantly faster runs.
In the early days of PSCAD, single-core computers were the norm, and consequently all PSCAD/EMTDC processes were performed sequentially over a single core, as shown in Figure 1(A).
By the early 2000’s, dual-core computers were becoming the standard, but were not suitable for parallel processing, since PSCAD and EMTDC were separate processes already. It was only after 2006, with four-core computers becoming available, that parallel processing became viable. Efforts to develop these features began in earnest in 2010, with the first prototype realized in 2012. This process has since evolved, using in two efficient and widely-used parallel computing paradigms, data parallelism and task parallelism, and with PSCAD now securely entrenched in the world of Parallel, Distributed and High Performance Computing (HPC).
Parallel Multiple Run
For intense studies involving the activity of running one project under many different conditions at the same time, such as parametric study problems, a data parallelism feature called Parallel Multiple Run (PMR) was developed. This feature was formerly known as Volley Launch. In PMR, the simulations are run simultaneously over multiple cores on one or more computers, thereby obtaining significantly faster results than running them sequentially on a single core.
The Multiple-run Component that was used in earlier versions to automate these types of runs, while effective, is significantly slower than PMR, as the simulations are run in series over a single core. Performance studies comparing the PMR (Figure 1(B)) with the Multi-run Component (Figure 1(A)) have demonstrated simulation speed increases from between 18 to 33 times.
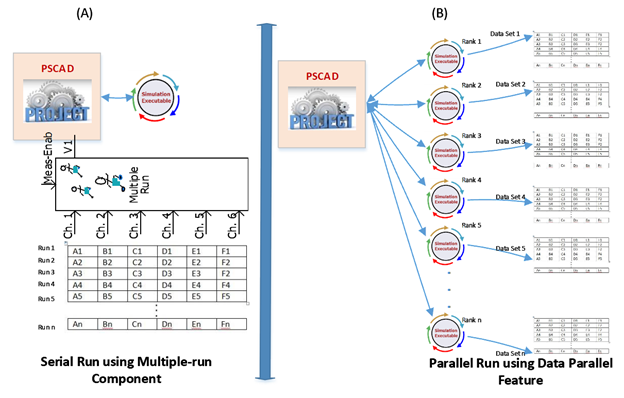
Figure 1: Serial Multiple-run Component vs. PMR for Parametric Studies
Test Case for Performance Evaluation – Parallel Multiple Run
A line switching study test case demonstrates the application of PMR. The case itself (see Figure 2) may be relatively simple, but the number of simulations and configuration changes required in order to collect the study information is extensive, at 500 runs.
.png)
Figure 2: Switching Study Case
Execution Test Rig and Performance – Parallel Multiple Run
The switching study was performed using the legacy Multiple-run Component in serial computing fashion, and using PMR in parallel computing fashion. The computers used were Intel Xeon E5-1650 v3 @ 3.5GHz (6 physical 12 hyper-threaded cores) with 16 GB Ram, and Intel Xeon E5-2687W v3 @ 3.10 GHz (20 physical 40 hyper-threaded cores).
The results of this test are shown in Table 1: Simulation speed increased from between 18 to 33 times when using PMR.
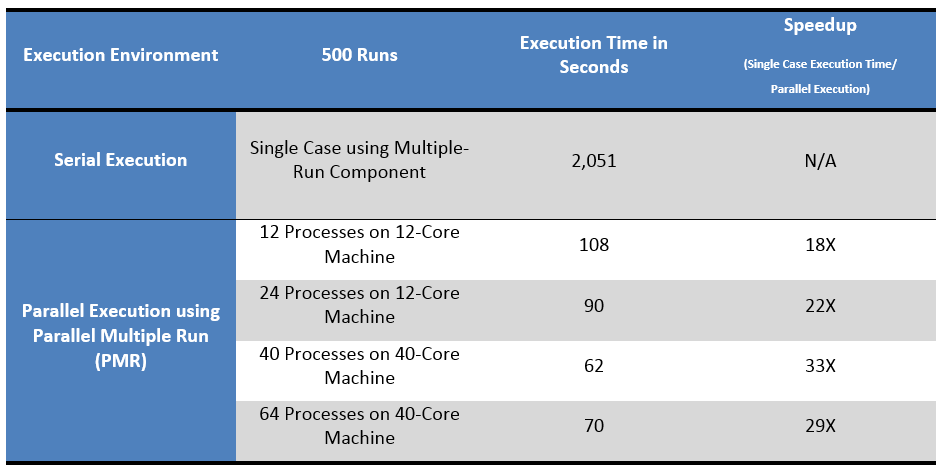
Table 1: Test Results – Serial Multiple-Run Component vs. Parallel Multiple Run (PMR)
A video showing the PMR is available.
Parallel Network Interface
The Parallel Network Interface (PNI) feature is used for running very large projects. This type of task parallelism was formerly known as Electric Network Interface (ENI). To use this feature, the project is developed as smaller inter-connected sub-projects, each of which is solved on an individual computer core. These simulations are run in parallel, resulting in significantly greater simulation speeds than when the entire project is run as a single simulation on a single core (see Figure 3). Performance studies comparing PNI with legacy serial simulation have demonstrated simulation speed increases from between 3.2 to 4.4 times.
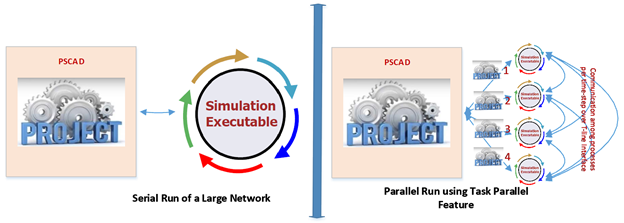
Figure 3: Serial vs. Parallel Run using Parallel Network Interface (PNI)
Test Case for Performance Evaluation – Parallel Network Interface (in Radial Configuration)
A wind-farm network, comprising of a radial collection grid connected with ten Type 3 Generators demonstrates the application of PNI (Figure 4). Each machine is modelled in full detail with complete control and protections systems (Figure 5). Wind speed is converted to torque on the machines based on standard specifications. Back-to-back converters are modeled in full detail.
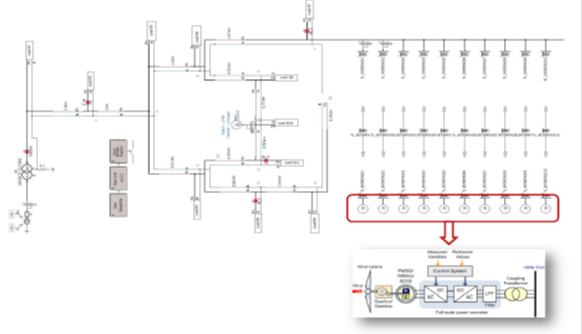
Figure 4: The Collection Grid Connected with ten Generators in a Wind Farm
Note
No lumped models were used to simulate this wind park. All machines and control systems are modelled in full detail.
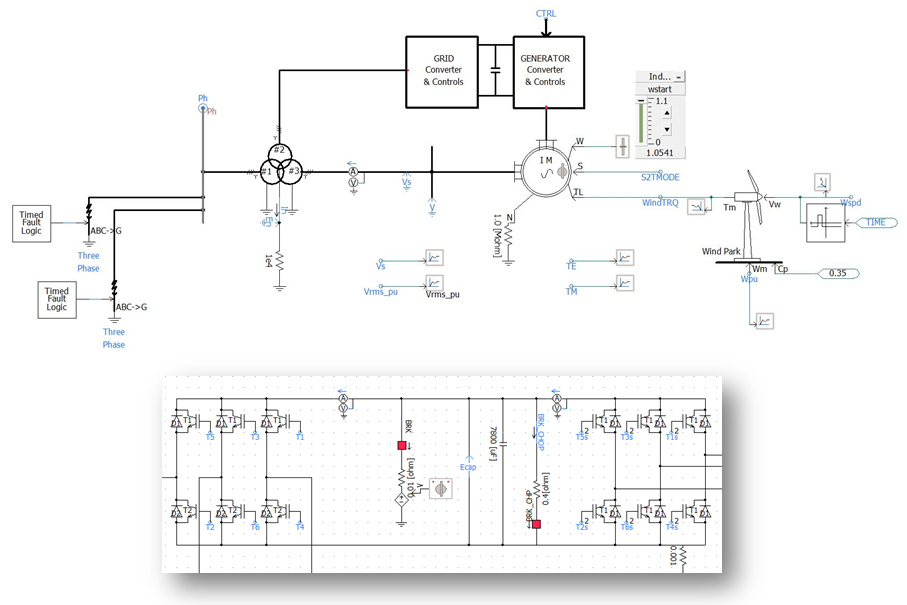
Figure 5: DFIG Machine Model and Detailed Control and Protections System
Execution Test Rig and Performance – Parallel Network Interface
The study was performed by running this case as one single project in legacy serial computing fashion, as well as dividing this project into multiple sub-projects and running them on separate cores using PNI.
The simulation runtime was set to 10 Seconds with a time-step of 10 µs, chosen to standardize all of our tests to run 1 Million time-steps. The computers used were Intel Xeon E5-1650 v3 @ 3.5GHz (6 physical 12 hyper-threaded cores) with 16 GB Ram and Intel Xeon E5-2687W v3 @ 3.10 GHz (20 physical 40 hyper-threaded cores).
The results of this test are shown in Table 2: Simulation speed increased from 3.2 to 3.5 times.
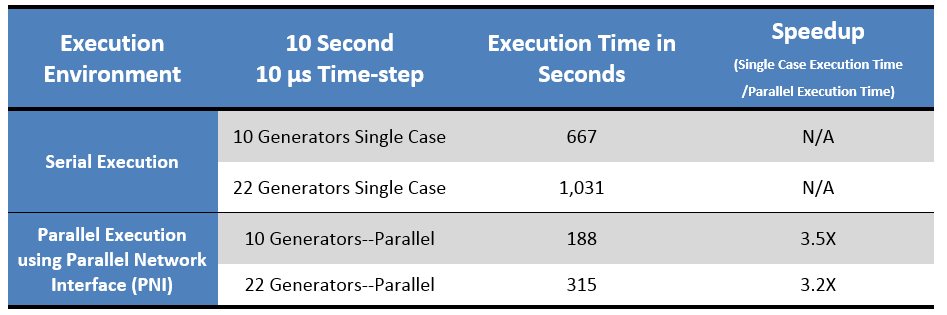
Table 2: Serial vs. Parallel Execution Times and Speedups - DFIG Machine Model and Detailed Control and Protections System
Benchmark Case Performance Evaluation – Parallel Network Interface (in Mesh Configuration)
A nine-terminal DC Grid Cigre benchmark case in mesh configuration (Figure 6) was tested using PNI to quantify the performance gains of parallel computing over serial computing. This benchmark network has nine Voltage Source Converters connected to each other with AC or DC Cables. The simulation was run for 25 second 25 µs time-step to standardize tests for 1 million time-steps.
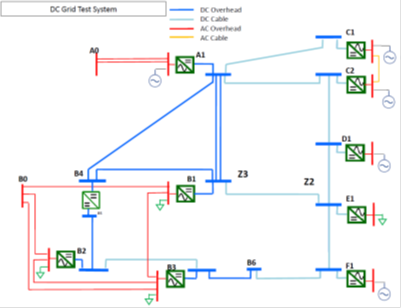
Figure 6: Nine-Terminal DC Grid Benchmark
The results of this test are shown in Table 3: Simulation speed increased by 4.4 times.
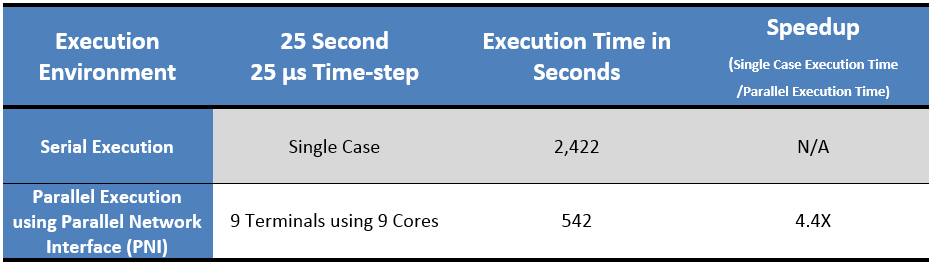
Table 3: Serial vs. Parallel Execution Times and Speedups - Nine-Terminal DC Grid Benchmark
Materials related to Parallel Network Interface are available.
Cluster Launch System
Cluster Launch System (CLS) is a feature in PSCAD V5.0 that allows the user to quickly create a computational environment by grouping LAN connected computers to increase the number of computational cores for their parallel simulation needs. PSCAD, by using CLS, launches simulations on multiple remote computers by a click of a button. To launch simulations using CLS on multiple computers only one license of PSCAD is needed. More information about CLS can be found in this article and in this webinar.
Additional Information - Parallel and High Performance Computing
Webinar - A General Overview of High Performance Computing in PSCAD V5 (February 24, 2021)
Webinar - Parallel and High Performance Computing (Part 1)
Webinar - Parallel and High Performance Computing (Part 2)
Requirements for High Performance Computing
Modeling Very Large Power Systems Brochure
Parallel and High Performance Computing Brochure PSCAD X4
Parallel and High Performance Computing Brochure PSCAD V5
Cluster Launch System PSCAD V5
Speeding up Simulations
Versions
Electric Network Interface (ENI) or Parallel Network Interface (PNI) – V4.6.0 +
Root Control Interface – V4.5.1 +
Volley Launch – V4.6.0 +
PMR-I (Root Control Interface is re-named) – V4.6.0 +
PMR (Parallel Multiple Run) – V5.0 +
Cluster Launch System – V5.0 +