
Enerplot V1.1 Features
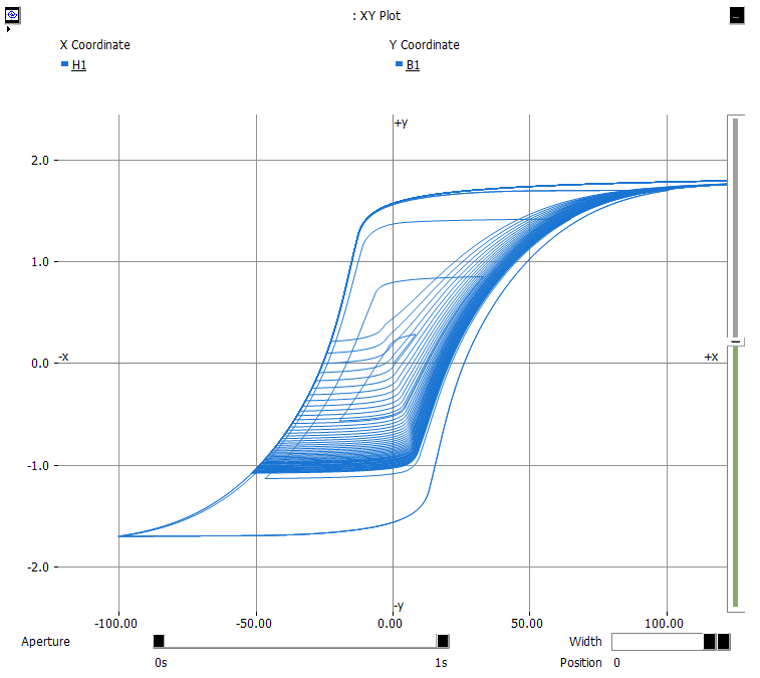
Fast, Efficient and Mature Plotting Tools
The plotting tools available in Enerplot have been in use in industry for almost 25 years. Built initially for use in PSCAD/EMTDC, a world-renowned electro-magnetic transients simulator, these mature tools are optimized for speed and efficiency.
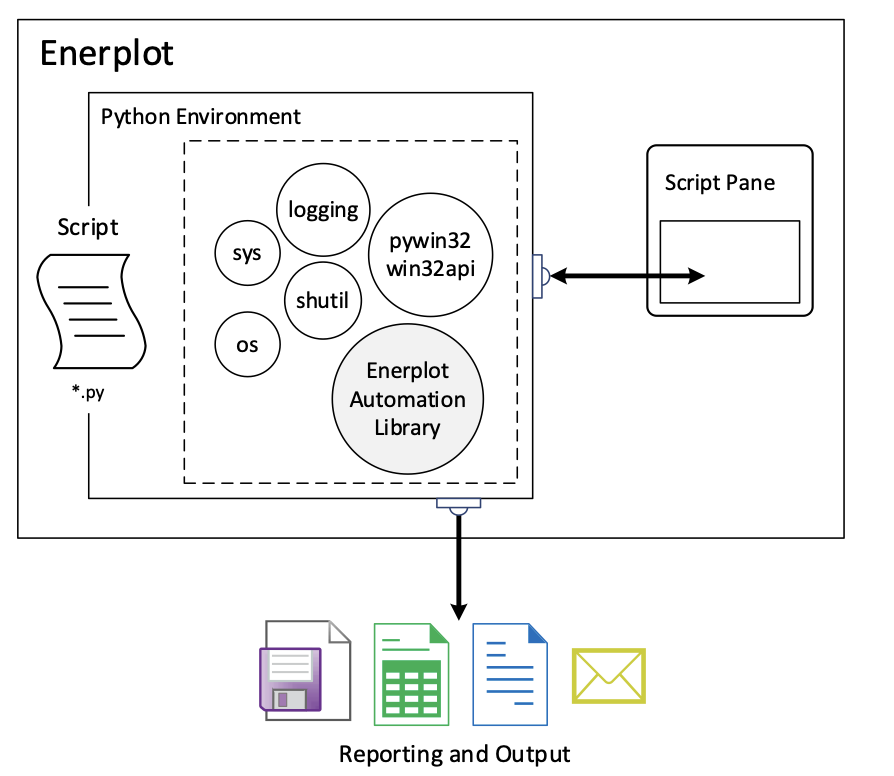
Automation: Embedded Python Scripting with Recording
Automation of the Enerplot application, utilizing custom-made Python language scripts, was first introduced in v1.0. It includes commands to launch the software, load and run simulations, change parameters, and analyse data, among many others. In v1.1, the automation interface has been updated to our latest design, which is the same one used in other MHI, Ltd. products, such as PSCAD.
Embedded Python Automation Interface, in Enerplot v1.1
Users can continue to maintain their scripts from within Enerplot, using the upgraded Script pane, from which custom scripts may be recorded, edited, or launched.
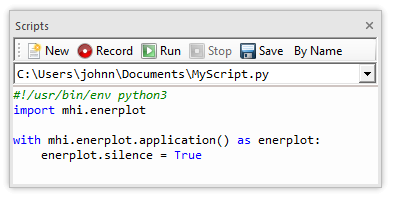
Script Pane
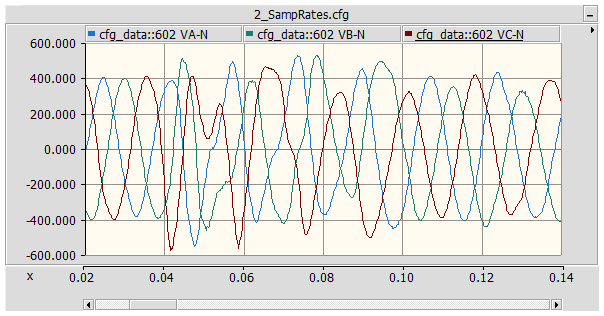
Support of Output Files from Popular Software
Enerplot supports output data files from several different applications. Data from any of the following types of output files may be loaded as a dataset and used to create curves in graphs:
- PSCAD/EMTDC files:
- EMTDC output (*.inf, *.out, *.psout)
- PSCAD Harmonic Frequency Scanner Output File
- COMTRADE files (*.cfg) – 1991, 1999, both ASCII and Binary
- PSS®E (*.out, *.outx, *.asc) – v33 and v34
- RSCAD (*.out)
- PSLF files (*.acf, *.chf)
- dcLFL Analog Trigger files (*.ana)
- Comma Separated Values (*.csv)
Note that any data file from any format, loaded as a dataset in Enerplot, may be converted and saved to either Comma Separated Value (*.csv) or COMTRADE (*.cfg) ASCII and Binary formats (except PSCAD Harmonic Frequency Scanner Output File, which may only be converted to *.csv).
New Record Creation
Users can generate custom records, based on existing records already loaded into the work environment, by using the record wizard.
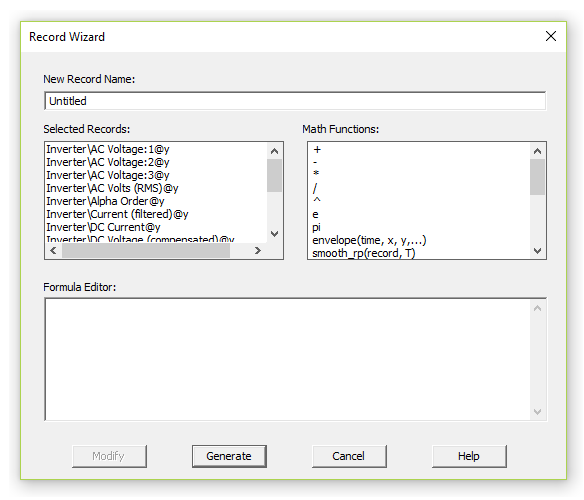
The record wizard utilises a text-based math parser to calculate a new set of record data, based on the data from one or more existing records. Records may be added or subtracted from each other, for example. Or mathematical functions may be applied directly to a set of record data, such as a scale factor or other more complex operations.
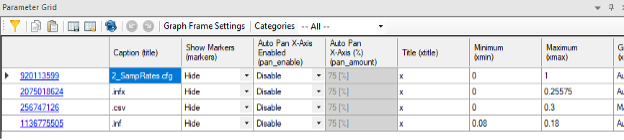
Paramater Grid View Pane
Parameter Grid View Pane
The Parameter Grid pane provides a convenient means to display the various properties of a canvas objects in Enerplot. More importantly, it enables the ability to modify multiple property values in multiple objects, simultaneously. Simply right click on an object and select View Parameter Grid… to invoke this pane.
The parameter grid is supported for the following objects:
- Books, Sheets and Data Sets.
- Standard Graph Frames, FFT Graph Frames and XY Plot Frames.
- Curve Properties
- Sticky Notes, Captions and Dividers.
Multiple Language Support in Sticky Notes (Unicode)
The Enerplot code base has been updated to fully support Unicode, which enables users to use all known writing systems within sticky notes. This of course includes the Cyrillic alphabet, Chinese characters, etc. This is a very important new feature, which has been passionately requested by many of our Asian users.
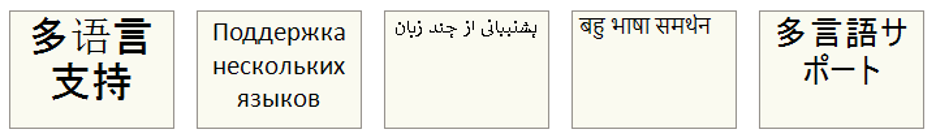
Unicode support also allows Enerplot files that are stored within folders with multi-language names, to be opened/saved.
Searching
Search facilities have been added to Enerplot! Now you can search for text in a single book or across the entire workspace. Simply enable the Search pane from the ribbon bar, or press Ctrl + f on your keyboard. When a search is performed, the results are displayed in a Search Results pane containing navigable links.
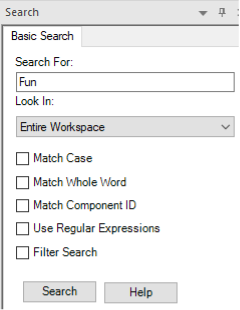
Search Pane
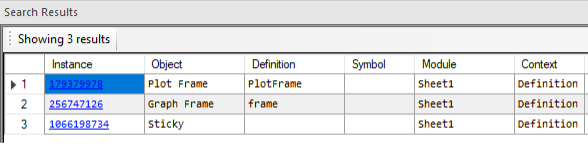
Search Results Pane