
Statistical Breaker
Latest update: February 20, 2022
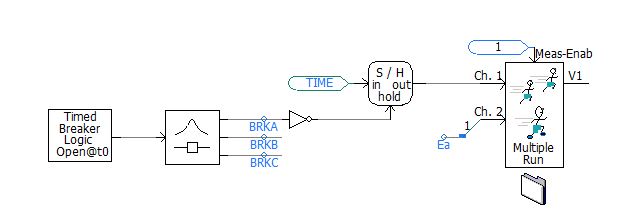
This example discusses the statistical breaker model in PSCAD.
-
The generated samples by the statistical breaker is a normal distribution.
-
The statistical breaker generates three individual breaker close status signals within a user-defined delay time interval. For example, if minimum time delay (MinTD) = 0 and maximum time delay (MaxTD) = 0.004 sec, the user-defined delay time interval is 0.004 sec.
-
The statistical distribution close each individual breaker within the user-defined delay time interval (0.004 sec).
-
With the Number of Standard Deviations in the interval, the mean (µ) of the distribution is the middle of the user-defined delay time interval. For example mean = 0.004 sec / 2 = 0.002 sec
-
If the number of standard deviations is set to 4, the closing signal to each of the phases be grouped closer to the mean (0.002 sec). So the distribution curve would be steep and there would be less breaker operations closer to MinTD and MaxTD.
-
If the standard deviation is set to 1, the slope would be more “flat” and distribution curve would be flat and there would be more breaker operations closer to MinTD and MaxTD.
-
The Multiple Run provides a Random-Flat variable output over defined delay time interval. However the statistical breaker model forces a more normal distribution of close signals based on the input signal.