
Calculating Bode Plots
Last Update - February 20, 2022
The attached example generates the Bode Plots (Magnitude and Phase) data points for a given frequency range. By default the examples uses the real pole function. The differential pole function is also included in this example. Other functions can be derivied in a similar fashion as the real and differential pole functions.
Supported Software
PSCAD V5 and GFortran v4.6.2
Instructions
- Download the attached file, unzip and save the contents to a local path on your machine (e.g. desktop).
- Launch and license PSCAD V5, and load Ex_BodePlot_PSCADV5.pscx.
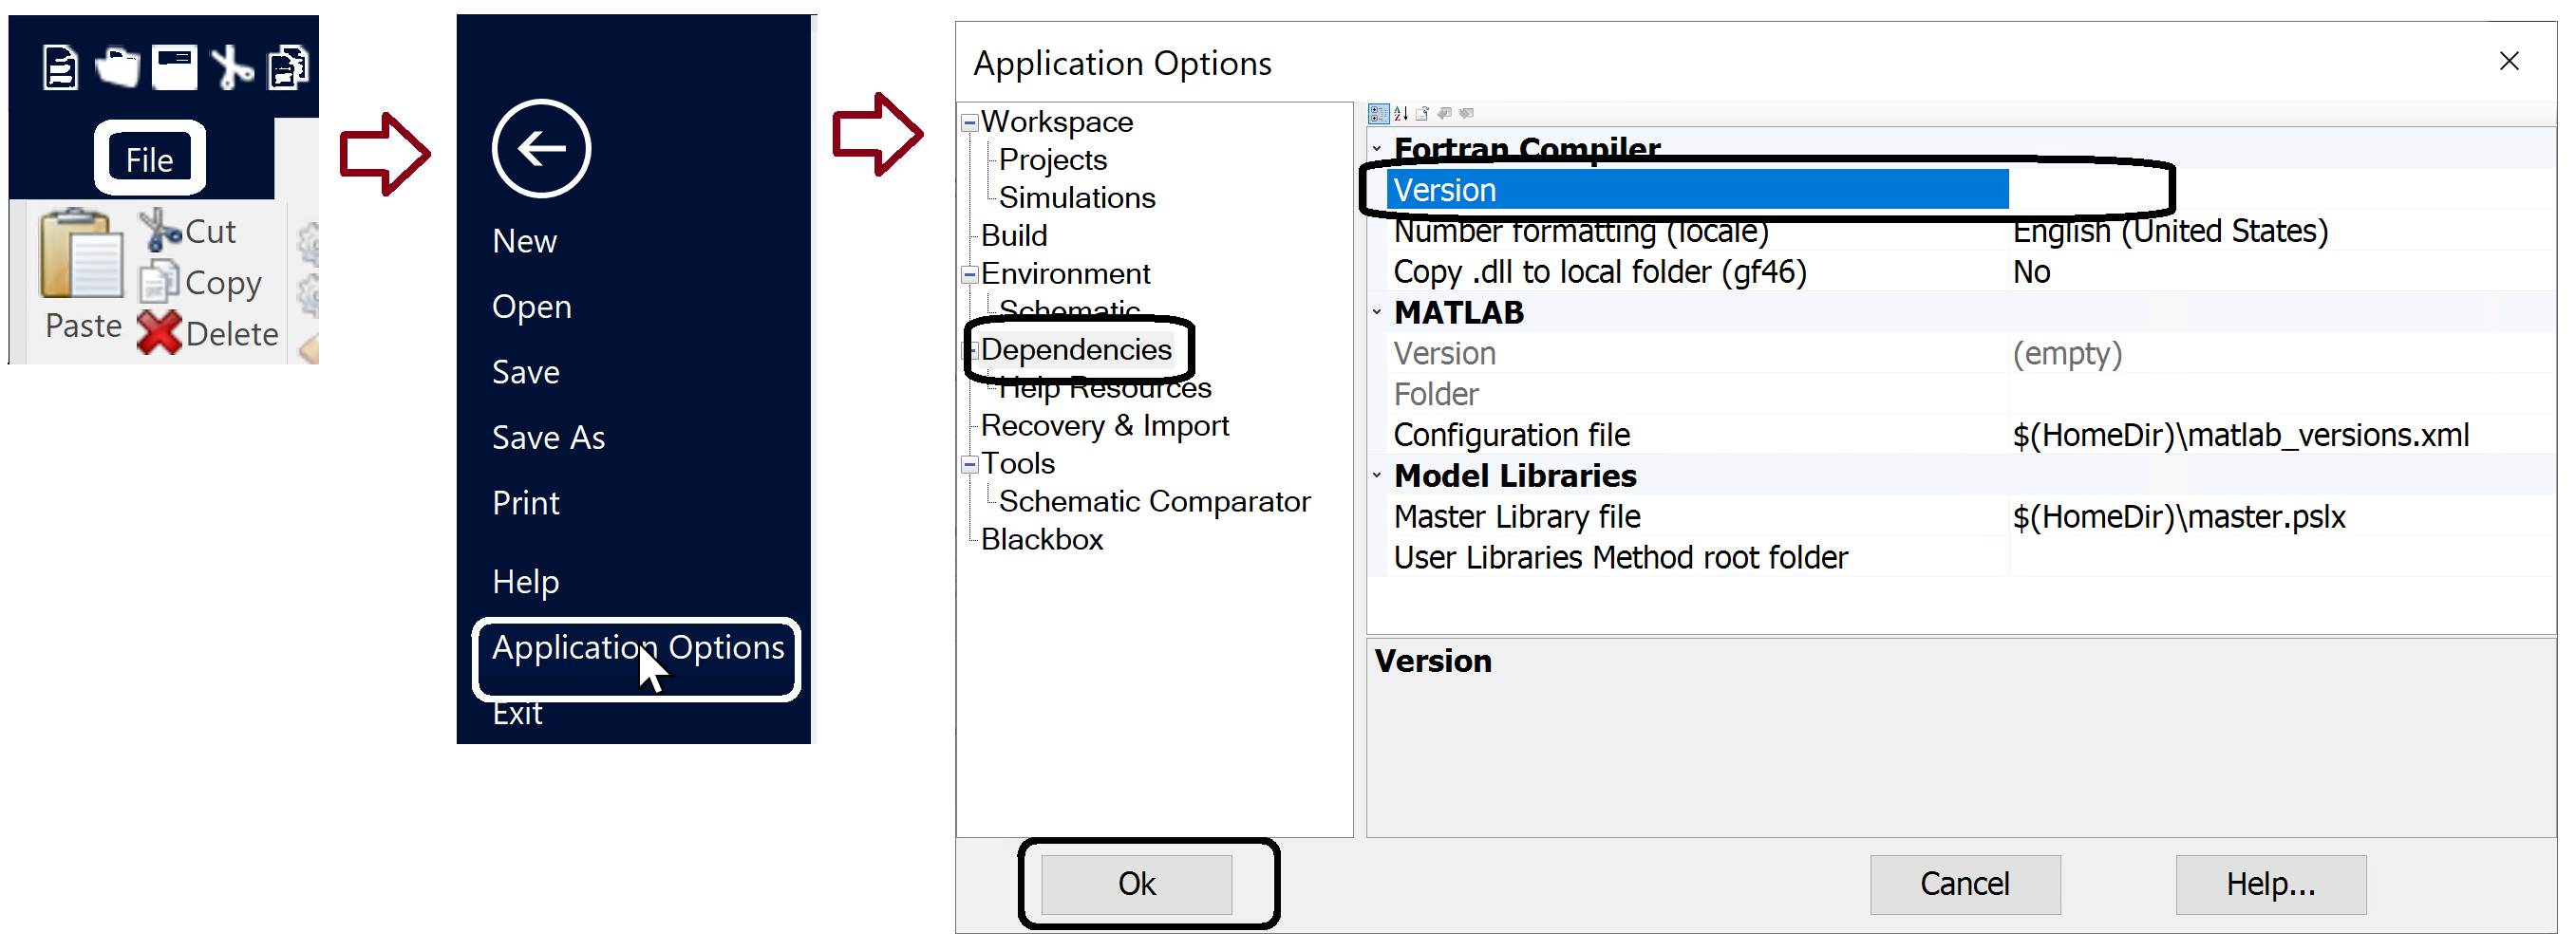
- Ensure PSCAD is configured to use GFortran v4.6.2:
- Set w0 and G.
- Set frequency range in Multiple Run component. Can also change other settings as output file name, channels being recorded, etc.
- Run case (configured for GFortran 4.6.2) and view output data (in "File Reference" component that looks like a folder), or open corresponding BodePlot_PSCAD.xlsx Excel file.