Record Context Menu
Paste Curve in Graph
Translating or Scaling a Curve
Locating Minimum or Maximum Value
Cut/Copy/Paste an Existing Curve
A curve can be described as a graphical representation of a string of data points, where each point is associated with a time value. Curves are created by linking a dataset record, to which represents a scalar set of data defined in the dataset source file.
Adding a curve to a graph can be accomplished a couple of different ways:
Drag and Drop Method: Hold down the Ctrl key. Left-click and hold over one or more records in a dataset, from which you would like to extract the curve. Drag the mouse pointer over a graph and release the mouse button. See Drag and Drop for more details on this.
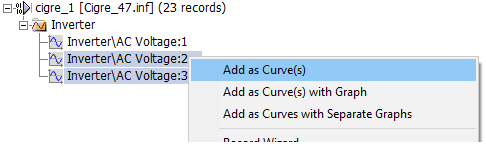
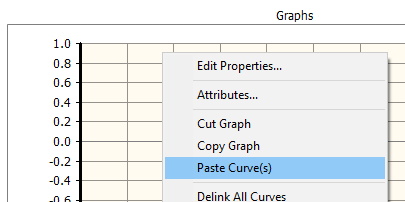
Manual Add Method: Right-click on one or more records in a dataset, from which you would like to extract the curve. Select Add as Curve(s). Select the desired graph with a left-click, then right-click and select Paste Curve.
|
|
Record Context Menu |
Paste Curve in Graph |
Note also that you can create a new single Graph with multiple curves added to it, or a new Graph Frame with multiple graphs (one for each curve). Select Add as Curve(s) with Graph or Add as Curve(s) with Separate Graphs respectively.
Once a curve has been added to a Graph, the curve title will appear in the curve legend.
Once multiple curves have been added to a graph, you may change the order in which they appear. Ordering curves can be accomplished in one of two ways:
Drag and Drop: Left-click and hold over the curve in the curve legend. Drag the mouse pointer to a new position in the curve legend and release the mouse button. See Drag and Drop for more details on this.
Right-Click Menu: Right-click over the corresponding curve legend and select one of the following from the pop-up menu: Move to the Start or Move to the End.

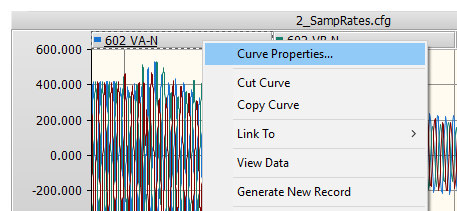
Right-click over the curve title and select Link To, to display from which dataset the record representing the curve is referenced. If you have multiple, identical datasets loaded, you can use the menu function to quickly switch between them.
See Dataset Linking for more details.
Select this option to invoke the Data View pane.
Select this option to generate a new record, based on the modifications made to this specific curve. Note that this operation will convert the dataset, from which this curve is linked, to a new, identical one containing this modified record.
Warning: Consult Exporting/Saving Datasets before proceeding.
Right-click over the curve title and select Smooth, to apply a smoothing function to the curve. You will be asked to a enter a time constant in seconds. The smoothing algorithm is described in Record Wizard | Math Functions.
NOTE: If you need to save your modifications to the curve, please see Generate New Record and Exporting/Saving Datasets before proceeding.
There is also an Unsmooth function, which reverts the last Smooth operation.
Curves may be translated in both the x and y directions, or scaled via a scale factor.
Curve Properties: See Adjusting Curve Properties.
Manual Translation (Shifting): The X and Y-Offset values can be adjusted manually by selecting the curve legend, and then press Shift + an arrow key to manually move the curve in the graph. You can reset the curve again by reverting the X and Y-Offset values in the Curve Properties.
Right-click over the curve title and select Locate Min or Locate Max Value. Enerplot will show the exact point on the curve (using a red crosshair) that is the maximum or minimum value. If the Data View pane is open, the correct data point will also be shown there.
Right-click over the curve title and select either Cut Curve or Copy Curve, depending on what you want to do. Right-click over any graph and then select Paste Curve to paste the curve. The curve should then appear in the corresponding curve legend.
If a simulation has been run and a particular curve contains data, you have the option of copying all or a portion of this single curve data set to the clipboard. Right-click over the corresponding curve name, select Copy Data to Clipboard and then select one of the following from the pop-up menu:
All: Copies all curve data available
Visible Data: Copies only curve data that is visible in the graph window.
Between Markers: Copies only curve data situated between markers. Note that Show Markers must be selected in the Axis Properties dialog.
The data is copied as Comma Separated Variables (*.csv) format for easy migration into common data analysis software.
Left double-click on the desired curve in the curve legend, or right-click the curve and select Curve Properties....
This will bring up the Curve Properties dialog window.
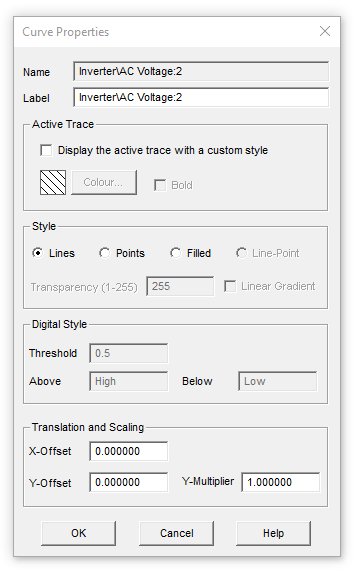
The following list describes the parameters in this section:
Display the active trace with a custom style: Select this option if you wish to change the colour or width of the active trace (curve).
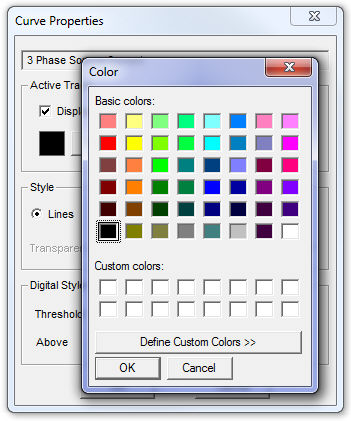
Colour: Press the Colour... button to select a display colour for the trace. Press the OK button in the colour dialog. This option is enabled only if Display the active trace with a custom style is selected.
Bold: Select this option if you wish the trace to appear bold. This option is enabled only if Display active trace with a custom style is selected.
The following list describes the parameters in this section:
Lines: Displays the curve as a standard line.
Points: Displays the curve as a series of points according to the set plot step.
Filled: Fills the area under the curve (between the curve and the 0.0 line) with the curve colour.
Transparency (1-255): Sets the transparency level of the filled portion under a curve. This is adjustable only when Filled is enabled.
Linear Gradient: Select this option to create a linear gradient effect on the filled part under the curve. This is adjustable only when Filled is enabled.
These options are only considered if the curve is part of a polygraph. Digital style controls the properties the curve traces when they are in digital mode. The following list describes the parameters in this section:
Threshold: The threshold value at which to change the display state of the curve.
Above / Below: Enter the state for the curve when value is above and below the set threshold respectively.
These options are provided to allow for adjustment of the curve in the graph.
The following list describes the parameters in this section:
X-Offset: The curve will be offset in the x-direction by this value.
Y-Offset: The curve will be offset in the y-direction by this value.
Y-Multiplier: Applies a scale factor of this value to each and every y-data point in the curve..
NOTE: If you need to save your modifications to the curve, please see Generate New Record and Exporting/Saving Datasets before proceeding.
Any changes may be reverted at any time by readjusting these parameter inputs.