Moving and Resizing a Graph Frame
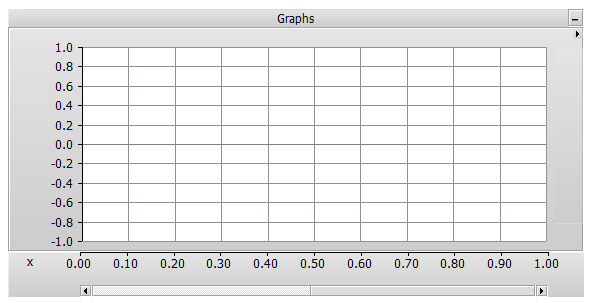
A Graph Frame is a special container used for encapsulating Overlay or PolyGraphs type graphs, and can be placed anywhere on the canvas pane. Graph frames are used exclusively for plotting curves versus time.
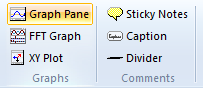
Right-click on a blank portion of the Canvas pane and select Add Component | Graph Frame, or press the Graph Frame button in Components tab of the ribbon control bar.
To move a graph frame, move the mouse pointer over the title bar and then left-click and hold. Drag the frame to where it is to be placed and release the mouse button.
To re-size, move the mouse pointer over the title bar and left-click to select the graph frame. Grips should then appear around the outer edge as shown below.
Move the mouse pointer over one of the grips. Left-click and hold and then drag then move the pointer to re-size.
Right-click over the graph frame title bar and select Cut Frame or Copy Frame respectively. Once a graph frame has been cut or copied it may then be pasted into another location in the project (along with its contents).
Cut or copy a graph frame as described above. Right-click over a blank area of the Canvas pane and select Paste. A graph frame may be pasted multiple times.
To access the Graph Frame Properties dialog, left double-click the frame title bar, or right-click over the title bar and select Edit Properties....
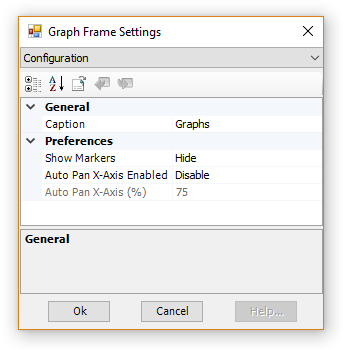
The properties available in this dialog are as described below:
Caption: Enter a title for the graph frame (this text will appear in the graph frame title bar).
Preferences:
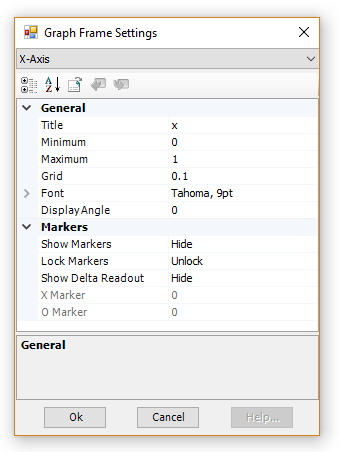
To adjust the X-Axis Properties dialog, left double-click over the graph frame horizontal axis, or right-click over the horizontal axis and select Axis Properties....
NOTE: Adjusting the horizontal axis properties will affect all graphs in the frame.
Axis:
Title: Enter a title for the x-axis. This text will appear in the bottom-left corner of the frame, directly beside the x-axis.
Minimum: Sets the minimum time of the viewed range.
Maximum: Sets the maximum time of the viewed range.
Grid: Sets the time between the axis major grid points. Major grid points are labelled on the graph frame horizontal axis.
Font: Sets the x-axis label font properties.
Display Angle: Sets the x-axis label display angle.
Markers:
Show Markers: Select this option to show the X and O markers.
Lock Markers: Once markers are displayed, the distance between them may be locked.
Show Delta Readout: Select this option to display the time difference (i.e. Dt) between the X and O markers. When this option is disabled, the equivalent 1/Dt value (i.e. frequency in Hz) will be displayed.
X Marker: Enter the position (in seconds) to place X marker.
O Marker: Enter the position (in seconds) to place O marker.