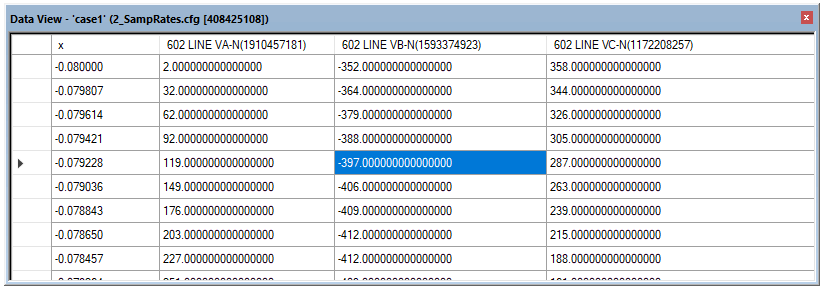
The data view pane is a separate window, which displays the record data numerically in table format for a selected graph or single curve. The record data in this table is dynamically linked to the corresponding dataset, allowing for the manual modification of data from the table. Also, selecting any data value in the table will place cross hairs on the corresponding graph, where the data is displayed.
Where,
Column |
Description |
x |
The x-axis values, normally time. |
RecordName(CurveID) |
The y-axis values for a particular record. The record name and curve ID are included. |
Note that the context of the data view pane depends on whether it was invoked from a single curve, or an entire graph.
The data view pane may be invoked in a few different ways:
|
|
|
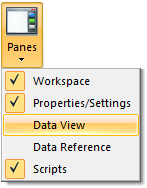
Ribbon View Tab |
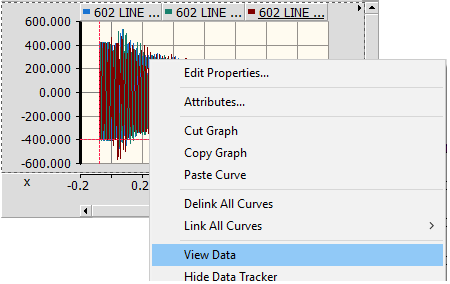
Graph Context Menu |
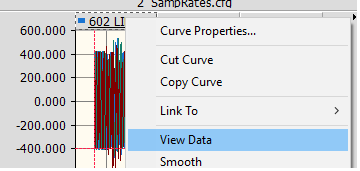
Curve Context Menu |
Note that once the data view pane is invoked, you may freely switch contexts (i.e. curves or graphs). The pane will update its table depending on what is selected.
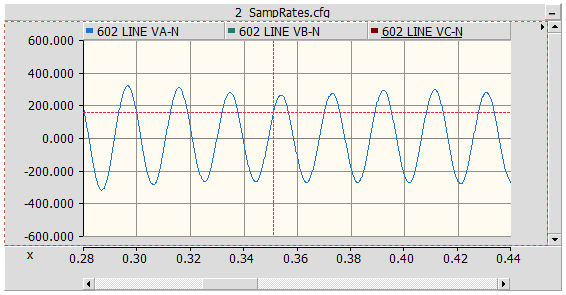
The data tracker is a red-dashed cross-hair, which appears automatically on the graph corresponding to a record data point selected in the data view table. The cross-hair shows the exact location of the data point. This also works in reverse: Selecting a point on a curve, will highlight that record value in the data view table.