What's New?
v1.1.0
v1.0.0
v1.1.0
The first minor update the initial release of Enerplot.
New Features
- Support for New Import File Types: A handful of new file types are now supported for import into the Enerplot environment:
- EMTDC Binary Output (*.psout) Files: A brand new EMTDC output file format (*.psout) is included with the PSCAD V5 release. A proprietary design, this new format is binary, which ensures a much smaller storage footprint, as well as faster data access.
- PSLF: Enerplot now supports the import of GE PSLF (*.acf and *.chf) files.
- DCLFL: Output (*.ana) files from the MHI product, DC Line Fault Locator are now supported (#7787).
- EMTDC *.infx File Format Support Deprecated: Support for the EMTDC output information file (*.infx) has been deprecated in Enerplot v1.1. *.infx files can no longer be loaded as datasets, however existing workspaces with these datasets already loaded will still function properly. Please instead use the equivalent EMTDC output information file (*.inf) to import EMTDC output data.
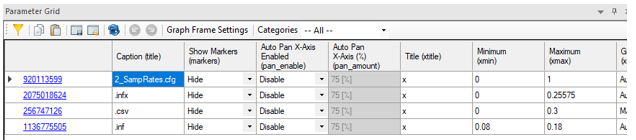
- Parameter Grid Pane: The Parameter Grid pane provides a convenient means to display the various properties of a canvas objects in Enerplot. More importantly, it enables the ability to modify multiple property values in multiple objects, simultaneously. Simply right-click on an object and select View Parameter Grid… to invoke this pane. The parameter grid is supported for the following objects:
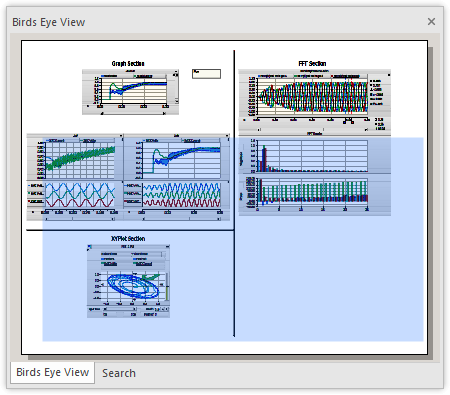
- Bird’s Eye View: A Bird’s Eye View navigation pane provides an overview of the entire sheet and indicates what is currently in view with a blue box. This tool may be used to easily zoom and navigate, and is particularly helpful when working with very large sheets.
- Multiple Language Support in Sticky Notes (Unicode): The Enerplot code base has been updated to fully support Unicode, which enables users to use all known writing systems within sticky notes. This of course includes the Cyrillic alphabet, Chinese characters, etc. This is a very important new feature, which has been passionately requested by many of our Asian users.
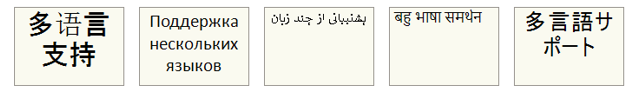
Unicode support also allows Enerplot files that are stored within folders with multi-language names, to be opened/saved.
- Searching: Search facilities have been added to Enerplot! Now you can search for text in a single book, or across the entire workspace. Simply enable the Search pane from the ribbon bar, or press Ctrl + f on your keyboard. When a search is preformed, the results are displayed in a Search Results pane, containing navigable links.
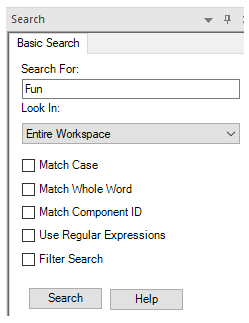
Search Pane
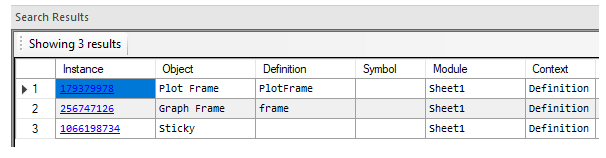
Search Results Pane
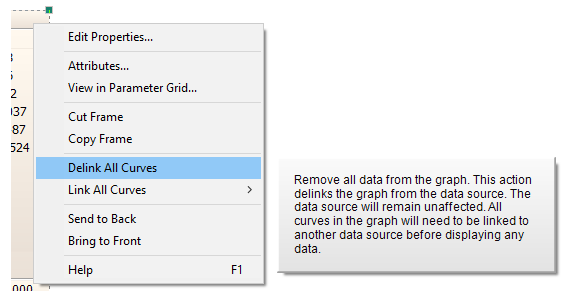
- Tool-tips: Context menu tool-tips have been added to most menu functions for quick reference:
- New Message Log Pane: A new type of message pane is included with Enerplot called the Message Log. This pane simply displays all messages that have been displayed to the user during the current session.
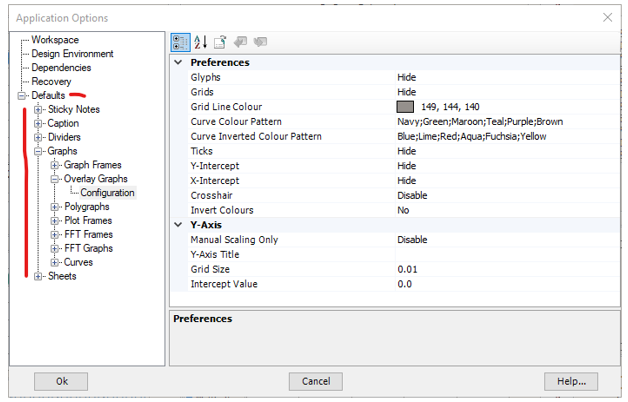
- Parameter Dialog Default Settings: The default settings of most properties/settings dialogs are now adjustable. For example, default automatic curve colouring in graphs can be adjusted to be more prominent. Default settings may be adjusted via the Application Options dialog:
- Freehand and Polygon Selector Tools: Two new selection tools have been added to the ribbon control bar.
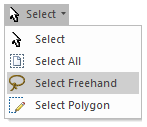
The freehand selector allows you to encompass a group of sheet objects in a freehand circle, similar to a ‘lasso’.
The other is a Point selector, where the components are encompassed with a polygon, or collection of points:
- New Look: Enerplot now sports a new look, more similar to PSCAD, PRSIM and other MHI software products.
- Miscellaneous Niceties: Here are some other more trivial niceties that have been added to the software:
- Reopen Book: A context menu command to reopen a book has been added.
- Continuous Zoom: Zoom in and out dynamically with mouse wheel, using the pointer as a centering point.
Functionality Deficiency Fixes
- ‘Under the Hood’ Improvements: A great deal of effort went into cleaning up and making the inner functionality of Enerplot faster and more efficient.
- Improved overall code architecture.
- Lazy (or quick) loading of datasets has been streamlined and vastly improved for speed.
- Data import in general is refactored for increased speed, efficiency and stability. Loading immense datasets now requires significantly less memory, and load speed has vastly improved.
- The Enerplot application is now much more efficient in terms of memory handling. It no longer uses large amounts of memory following repeated operations.
- Automation: Embedded Python Scripting With Recording Upgrade: Automation of the Enerplot application, utilizing custom-made Python language scripts, was first introduced in v1.0. It includes commands to launch the software, load and run simulations, change parameters, and analyse data, among many others. In v1.1, the automation interface has been updated to our latest design, which is the same one used in other MHI, Ltd. products, such as PSCAD.
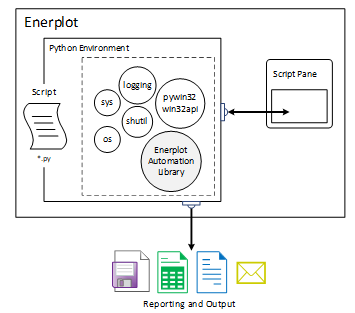
Embedded Python Automation Interface, in Enerplot v1.1
Users can continue to maintain their scripts from within Enerplot, using the upgraded Script pane, from which custom scripts may be recorded, edited or launched.
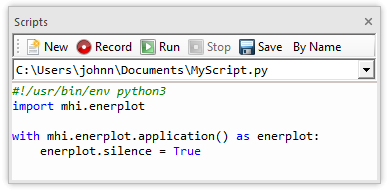
Script Pane
- Python Scripting Enhancements: New functionalities have been added to the Enerplot Python automation library, and hence allow for a wider range of recording capabilities. Some of these include:
- Generate a new record from a modified curve.
- Save a modified dataset.
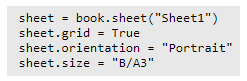
- Sheet canvas settings, such as grid, orientation and size have been given more obvious functionality for easy changeability in the script.
- Book header, title and footer have been given more obvious functionality for easy changeability in the script.
- Python script record now properly records X/O marker movements.
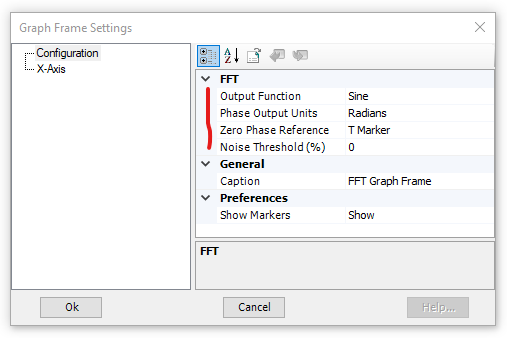
- FFT Enhancements : The FFT function in Enerplot has been enhanced to provide more accurate results, as well as some additional display options.
- All non-uniform plot step waveforms are now interpolated onto a fixed plot step grid, prior to being analysed by the FFT. This ensures the accuracy of all magnitude and phase angle quantities when analysing records with a variable plot step.
- New options have been added to control the output phase display in the FFT Graph Frame. Added are phase output units (degrees or radians) and phase output reference (sine or cosine).
- The time reference for the FFT phase angle calculation may now be specified. The choices are:
- Time 0.0
- Start of the FFT window
- Custom time
- In an attempt to reduce display noise, users can now control whether or not to display the phase angle, based on a given noise threshold.
- Record Wizard Enhancements: Several new math functions have been added to the record wizard function list. New math functions added:
- time
- Floor(record [,digits]): Allows specification of floor integer.
- Round(record [,digits]): Allows specification of rounding integer.
- Ceil(record [,digits]): Allows specification of ceiling integer.
- Ln: Natural logarithm.
- 2x
- e(x-1)
- Log2
- Ln(1+x)
- √3x: Cube root.
- √(x2+y2 ): Hypotenuse function.
- atan2(y, x): Two-argument arctangent.
- sinh, cosh, tanh, sinh-1, cosh-1, tanh-1: Hyperbolic functions.
- erf, erfc: Error and complimentary error functions.
- LGamma: Natural logarithm of the absolute value of the Gamma function.
- TGamma: Gamma function.
- Smart Paste: Cut/copy and paste just got a whole lot smarter in Enerplot. Now when an object is copied, a great deal more information is stored on the Windows clipboard, so that when it comes time to paste, an intelligent decision can be made, depending on the context of the where the object is being pasted. This can save click steps in many areas:
- Copy as Bitmap/Metafile functions have been removed. Now, simply copy and use the destination application (ex, Microsoft Word) to control how it is pasted.
- Add as Curve functions have been replace with a simply copy. The record can be pasted as a curve inside a graph, or pasted as new graph frame with the curve if pasted on a blank part of a sheet. When copying multiple records, a paste action will by default place all curves within a single graph (same as multiple record select + Ctrl + left mouse drag). If a single curve per graph is preferred, use multiple record select + Shift + left mouse drag.

- Dynamic Data View Pane: The Data View pane now dynamically responds to the current context. For example:
- Click on a single curve, only data specific to that curve is displayed.
- Click on a graph, the data for all curves in the graph is displayed.
- Click on a graph frame, the data for all curves in all graphs in that frame is displayed.
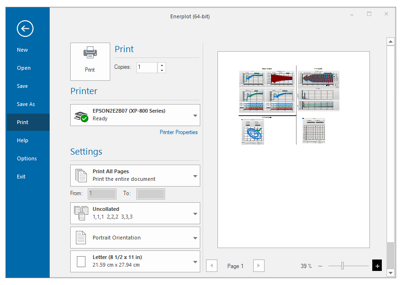
- Printing Facilities Upgraded: The printing facilities in Enerplot have been upgraded to a more modern architecture. This upgrade has rectified a handful of print-related issues.
- Curve Settings Dialog Upgraded: The curve settings dialog has been updated to the new XML form style, consistent with all other dialogs.
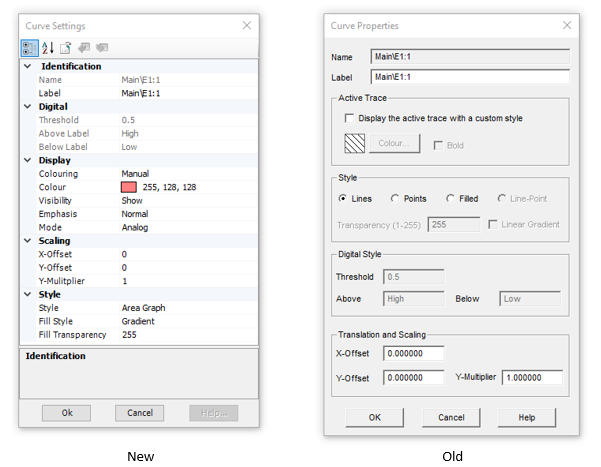
This update enables curve properties to be included when using the Parameter Grid feature.
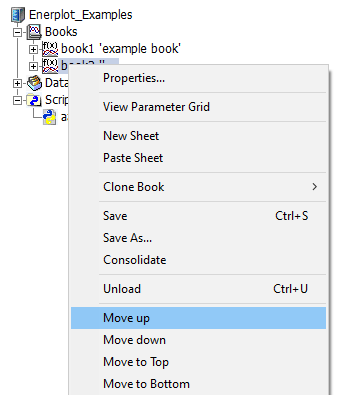
- Books Can Be Moved: If there are multiple books existing the workspace, users now have the ability reorder them by moving a book up or down the list.
Bug Fixes
- Special (accented or international) characters in the input data file folder path no longer block loading of the file (#7708).
- Using the Python properties() function on a Curve object no longer causes a crash (#7733).
- X-axis changes no longer are reverted when clicking on the aperture scroll bar, following adjustment via the graph properties (#7568).
- Zooming to x-axis extents will now properly zoom to the entire domain, in the specific case where the first time is not the minimum, or the last time is not the maximum (#7701).
- XY plot curve legend colours are now consistent. Previously, the y-axis curve was always coloured blue (#7745).
- Sticky note colour and opacity settings now function properly (#7319).
- An original dataset file is no longer modified if a new record is created in that dataset via Python script (#7836).
- Graph frame x-axis properties are now properly saved with the associated book (#8360).
- A Python script, which loads a workspace with a plot and channel, no longer causes the channel displayed in the plot to start loading in the background (#8477).
- Enerplot will no longer crash when recording, if the user attempts to load datasets from two or more files (#8556).
- Enerplot will no longer experience out of memory errors when importing immense data files (#8757).
- Fixed a crash that could occur when using a Python copy command of a component this not currently in view (#8715).
- Enerplot will no longer crash, if expected records are not present on load of dataset (#8841).
- Links to general and automation scripting web help now properly point their respective web addresses (7356).
- The curve flyby windows have been reduced in size considerably, and redundant or easily inferred information has been removed (including the path to the dataset) (#7693).
- Fixed all problems related to inconsistent font sizes in various viewing panes and miscellaneous frame sizing issues, resulting when increasing the Windows screen resolution (#8930).
- Corrupt or invalid data is no longer converted to a 0.0 value when importing a file as a dataset. Now, Enerplot converts invalid data to ‘NaN’, which persists in the data thereafter. The user is warned with a popup message that bad data is detected when adding the associated curve to a graph (#7372).
- The Open | Examples folder now always navigates to the examples folder, regardless of the Folder Access Tracking application option setting (#8687).
- All references to auto-pan have been removed from the graph frame properties (#7407).
- If a workspace tree element is selected and then another element is right-clicked, the original selected element is now properly deselected (#7368).
- Navigation and panning is much smoother due to some optimizations added in terms of refreshing curve display (#8943).
- Hotkeys (x, y, r, e) now function properly when the graph frame is under selection (as opposed to a single graph) (#8356).
- Very small multipliers entered for a curve (say 1e-8), no longer get rounded to zero (#8730).
- ‘Y’ shortcut key no longer zooms all graphs in a graph panel (just the selected graph) (#8844).
- Improved data view pane column headers to be more readable (#8997).
- Fixed incorrect message displayed when attempting to add more than three curves to the FFT graph (#8821).
- Fixed garbled messages that can appear from the record wizard (#8999).
- The workspace consolidator now supports and includes python script files (#7838).
- Book name is now properly reflected upon open into the workspace, if that book file had been copied and renamed first in file explorer (#8662).
- Application no longer crashes upon attempting to drag and drop a curve with associated with an invalid record (#8989).
- Record order is now properly preserved when adding several via drag and drop to the canvas (#8252).
- Ctrl + left click now properly adds graph frames to a selection, and Ctrl + left mouse drag select now properly adds components to the selection (#8252).
- Automatic graph zoom now considers the x and y-axis domain of the all curves existing in the graph. Previously only the last curve was considered, which caused problems with curves possessing different time lengths (#8668).
- Curve legend order is now properly preserved following a reordering of curves by addition and deletion (#9001).
- Users may now specify whether a copy actions stores only bitmap, only metafile, or both formats to the clipboard (#9030).
v1.0.0
Welcome to the first release of Enerplot! Here are some of the more important features offered in this initial version.
- Application Automation Using Python Script: Automate your repetitive tasks with the embedded Python-based scripting interface. Writing script files is easy: Simply press the record button and your actions will be recorded as Python script in a script file. See Application Automation with Python for a comprehensive guide.
- Lazy Loading: Load huge data files at lightening speed. When enabled, your data file structure will import without the actual data. When a curve is created from a data record, the data will load on the fly.
- Data File Support: Many types of data files are supported for import, including:
- PSCAD™/EMTDC™ output (*.inf, *.infx, *.out)
- COMTRADE (*.cfg) – 1991, 1999 both ASCII and binary\PSS®E (*.out, *.asc)
- RSCAD (*.out) (RTDS Technologies)
- Comma Separated Values (*.csv) – formatted and unformatted
- Text Files (*.txt) – formatted and unformatted.
Datasets sourced and loaded from any of the supported types above can be converted and saved as in either COMTRADE or Comma Separated Variable (*.csv) format.
- Embedded Math Parser: uCalc, a Powerful, embedded math parser for creating and modifying new and pre-existing curves is included as part of the record wizard.
- Plotting Tools: Enjoy the same powerful plotting tools, as used for over 15 years in PSCAD/EMTDC.