Moving and Resizing a Graph Frame
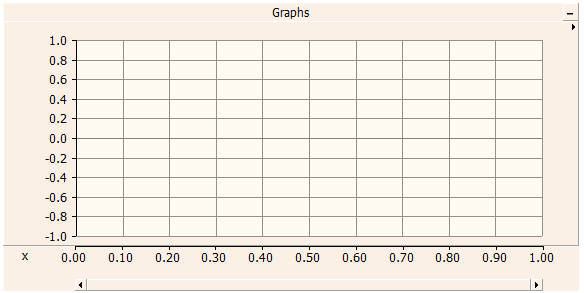
A Graph Frame is a special container used for encapsulating one or more Overlay or PolyGraphs type graphs, and can be placed anywhere on the canvas pane. Graph frames are used exclusively for plotting curves versus time.
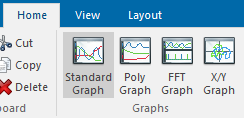
Right-click on a blank portion of the Canvas pane and select Add Component | Graph Frame, or press the Standard Graph button in Home tab of the ribbon control bar.
To move a graph frame, move the mouse pointer over the title bar and then left-click and hold. Drag the frame to where it is to be placed and release the mouse button.
To re-size, move the mouse pointer over the title bar and left-click to select the graph frame. Grips should then appear around the outer edge as shown below.
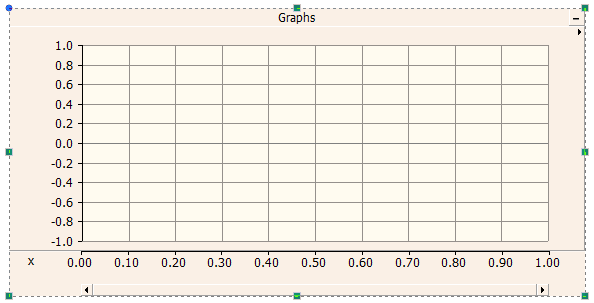
Move the mouse pointer over one of the grips. Left-click and hold and then drag the mouse pointer to re-size.
Right-click over the graph frame title bar and select Cut Frame or Copy Frame respectively. Once a graph frame has been cut or copied it may then be pasted into another location in the project (along with its contents).
Cut or copy a graph frame as described above. Right-click over a blank area of the Canvas pane and select Paste. A graph frame may be pasted multiple times.
To access the Graph Frame Properties dialog, left double-click the frame title bar, or right-click over the title bar and select Edit Properties....
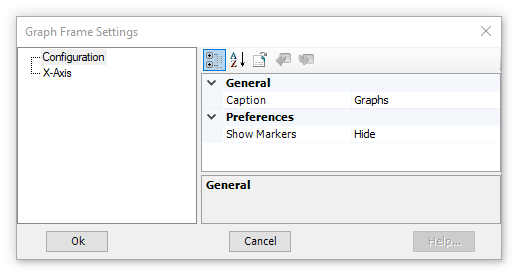
The properties available in this dialog are as described below:
General:
Caption: Enter a title for the graph frame (this text will appear in the graph frame title bar).
Preferences:
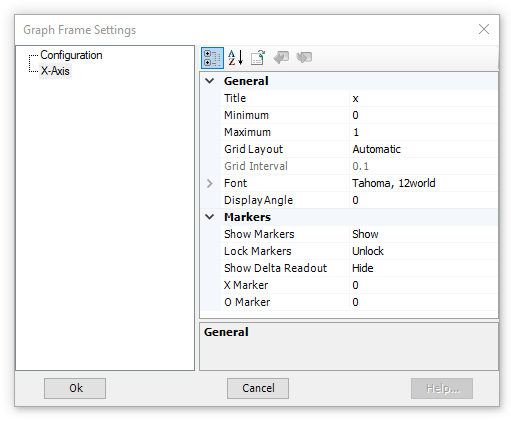
To adjust the X-Axis Properties dialog, left double-click over the graph frame horizontal axis, or right-click over the horizontal axis and select Axis Properties....
NOTE: Adjusting the horizontal axis properties will affect all graphs in the frame.
General:
Title: Enter a title for the x-axis. This text will appear in the bottom-left corner of the frame, directly beside the x-axis.
Minimum: Sets the minimum time of the viewed range.
Maximum: Sets the maximum time of the viewed range.
Grid Layout: Select Automatic or Manual. When in Automatic mode, the Grid Interval is automatically adjusted, depending on view frame or zoom level.
Grid Interval: Sets the time between the axis major grid points. Major grid points are labelled on the graph frame horizontal axis. This option is enabled only if Grid Layout | Manual is selected.
Font: Sets the x-axis label font properties.
Display Angle: Sets the x-axis label display angle.
Markers:
Show Markers: Select this option to show the X and O markers.
Lock Markers: Once markers are displayed, the distance between them may be locked.
Show Delta Readout: Select this option to display the time difference (i.e. Dt) between the X and O markers. When this option is disabled, the equivalent 1/Dt value (i.e. frequency in Hz) will be displayed.
X Marker: Enter the position (in seconds) to place X marker.
O Marker: Enter the position (in seconds) to place O marker.