Moving and Re-sizing an XY Plot Frame
Adjusting XY Plot Frame Properties
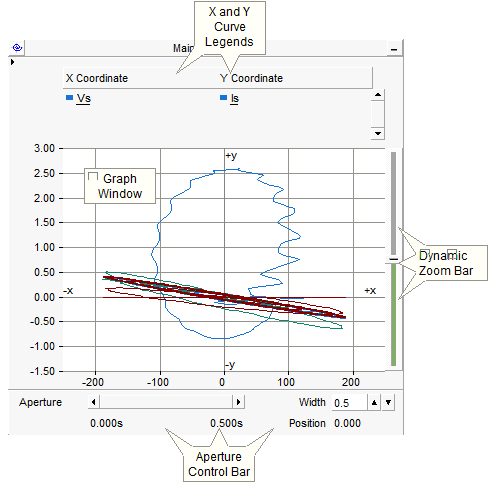
The XY Plot is comprised of both a graph frame and a single, specialized graph window for the purpose of plotting one curve versus another. An xy plot can accommodate multiple curves on each of the x and y-axes, and includes dynamic zoom and polar grid features.
Although the xy plot is used to plot one signal versus another, each of these signals is based on the same time scale. It is therefore possible to scroll through the data in the time domain: The xy plot includes a time domain aperture control bar, located at the bottom of the plot frame.
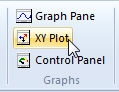
Open the project in the Circuit view. Right-click on a blank portion of the page and select Add Component | XY Plot, or press the XY Plot button in the Components tab of the ribbon control bar.
To move an xy plot, place the mouse pointer over the title bar and then left-click and hold. Drag the plot frame to where it is to be placed and release the mouse button.
To re-size the frame, move the mouse pointer over the title bar and left-click to select it. Grips should then appear around the outer edge as shown below.
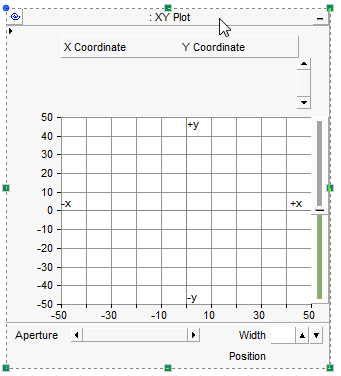
Move the mouse pointer over one of the grips. Left-click, hold and drag the pointer to re-size.
Right-click over the xy plot title bar and select Cut or Copy respectively.
Cut or copy an xy plot as described above. Right-click over a blank area of the Circuit canvas and select Paste. An xy plot may be pasted multiple times.
If a simulation has been run and your xy plot contains curve data, you have the option of copying all or a portion of this data to the clipboard.
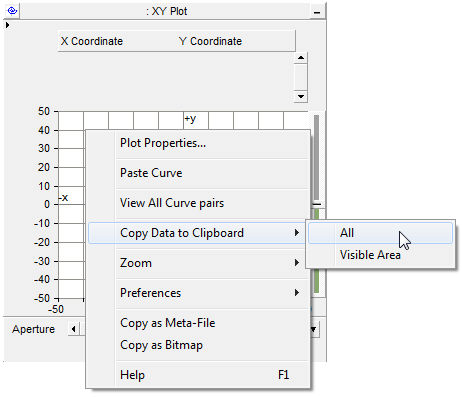
The data is copied as Comma Separated Variables (*.csv) format for easy migration into common data analysis software.
Two choices are given:
All Data: Copies all curve data available.
Visible Data: Copies all curve data visible in the plot window.
To access the Plot Frame Properties dialog, left double-click the plot title bar, or right-click over the title bar and select Plot Frame Properties.... This should bring up the Plot Frame Properties dialog window.
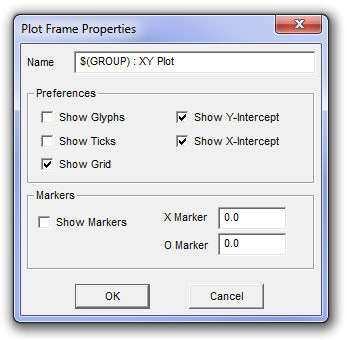
There are various parameters that may be edited though this window, each of which are described below.
Name: Enter a title for the xy plot (this text will appear in the frame title bar). The default text may appear a bit cryptic: This syntax is used as a naming convention for grouping objects in the workspace. For more information on this syntax, see Grouping of Runtime Objects.
Preferences:
Show Glyphs: Select this option to show glyph symbols on all curves.
Show Ticks: Select this option to show major grid tick marks along the x and y-axis intercept lines.
Show Grid: Select this option to display grid lines for the x-axis and y-axis major grids.
Show Y-Intercept: Select this option to display the y-intercept (horizontal) intercept line. The y-intercept is always at zero, and cannot be adjusted.
Show X-Intercept: Select this option to display the x-intercept (vertical) intercept line. The x-intercept is always at zero, and cannot be adjusted.
Markers:
Show Markers: Select this option to show the X and O markers.
X Marker: Enter the position (in seconds) to place X marker.
O Marker: Enter the position (in seconds) to place O marker.
Left double-click over the plot area (white part), or right-click over the plot area and select Plot Properties.... This should bring up the Plot Properties dialog window.
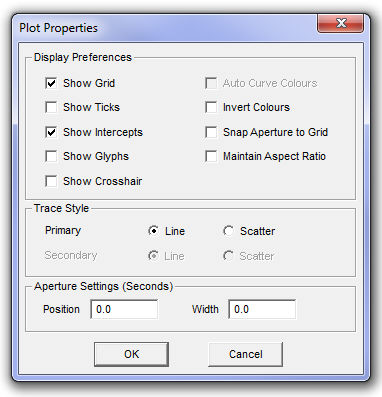
There are various parameters that may be edited though this window, each of which are described below.
Display Preferences:
Show Grid: Select this option to display grid lines for the x-axis and y-axis major grids.
Show Ticks: Select this option to show major grid tick marks along the x and y-axis intercept lines.
Show Intercepts: Select this option to display both intercept lines (horizontal and vertical). The intercepts are always at zero, and cannot be adjusted.
Show Glyphs: Select this option to show glyph symbols on all curves in the graph.
Show Cross Hair: Select this option to invoke the cross hairs mode.
Auto Curve Colours: Select this option to use automatic colouring of curves in the graph. You cannot change curve colour manually when this option is selected.
Invert Colours: Select this option to give the graph a black background (instead of white or yellow).
Snap Aperture to Grid: Select this feature so that when using dynamic aperture adjustment, the aperture view will snap to the major grid while zooming.
Maintain Aspect Ratio: Select this option in order to maintain the aspect ratio of the plotted curve (in both the x and y directions) whenever the plot frame is resized. If this option is disabled, the plotted curve will stretch or compress according to the actual shape of the plot frame.
Trace Style:
Primary: Select whether to draw traces as Line or Scatter view. Scatter view simply adds a single dot for each X-Y coordinate.
Aperture Settings (seconds):
Position: Enter the starting position in seconds of the aperture window.
Width: Enter the width in seconds of the aperture window.
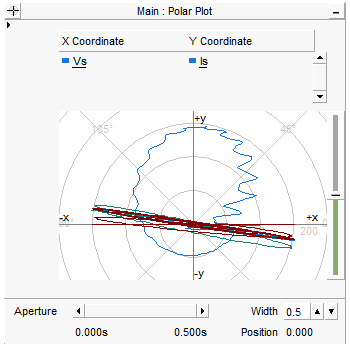
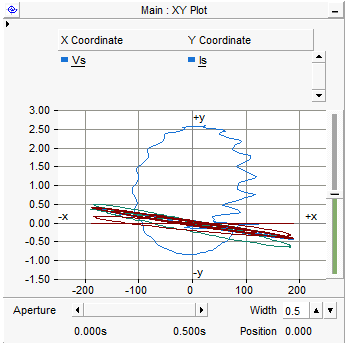
The default Cartesian (XY) grid display can be switched to a polar grid by simply toggling the xy/polar display button at the top-left of the plot frame.

The polar and xy grids are simply overlaid on top of the plotted data:
|
|
Polar Grid |
Cartesian Grid |
See Dynamic Zoom in XY Plots for more details.