Toggle Time Difference Frequency/Delta
Markers are a special feature included in both graph frames and xy plot frames to help users with the analysis of their online data. Specifically, they are used to delineate the data so as to focus analysis to that specific range. Depending on marker positions, legend displays will indicate the difference between the two markers in both the x and y directions.
Markers are used only on the x-axis (time axis) and will appear as two adjustable tabs. The marker tabs are labelled as X and O and the combination of the two set the specified boundaries. Once markers are set, analysis can be performed on the data contained within them.
Markers are used in a slightly different manner between graph frames and xy plots. Any differences are noted in the sections below.
There are a few ways to show or hide Markers:
Select the desired graph frame or xy plot with a left-click on the graph display area. Right-click over the graph to generate a pop-up menu and select Preferences | Show Markers.
Left double-click the graph frame horizontal axis, or right-click over the horizontal axis and select Axis Properties... to bring up the Axis Properties dialog. Select the Show Markers selection box.
Left double-click an overlay or polygraph, or right-click over the graph and select Graph Properties... to bring up the Graph Properties dialog. Select the Show Markers selection box.
If you are working with a graph frame, two tabs should appear along the horizontal axis. Each marker tab, labelled X and O, correspond to an x-axis (time) position.
If you are working with an xy plot, an extra display bar will appear at the bottom of the plot frame as shown below:
|
|
Aperture Control Bar |
Marker Display in Graph |
Once markers are enabled (shown) in a graph frame, legends will appear on the right hand side of the frame itself.
Each graph in the graph frame will have a legend directly to the right of the graph. The values displayed are specific to each graph and are described as follows:
X: Displays the y-axis value at the X marker position for the active trace.
O: Displays the y-axis value at the O marker position for the active trace.
D: Displays the difference between the above two values
Min: Displays the minimum value of the active trace within the marker boundaries
Max: Displays the maximum value of the active trace within the marker boundaries
The x-axis will also have its own legend where the values displayed are similar to those described above, but for the x-axis.
Once markers are enabled (shown) in an xy plot, a marker bar will appear at the bottom of the plot frame. As soon as either of these markers is moved, marker legends will appear directly to the right of each:
The values displayed are described as follows, specific to each marker:
x: Displays the marker x-axis value for the active trace.
y: Displays the marker y-axis value for the active trace.
T: Displays the marker time-axis value for the active trace.
The markers will only monitor the active trace of one curve at a time. If multiple curves exist in an overlay or polygraph, you can scroll through them by simply pressing the Space Bar on your keyboard. You may also conveniently select the desired curve in the graph legend.
When using xy plots, you must select the desired curve in the graph legend, as the Space Bar function is not available.
Once markers are enabled, there are a few ways to adjust their positions:
To manually adjust, place the mouse pointer over the marker tab in either the graph frame or xy plot, left-click and hold and drag it left or right. Release the left mouse button when the marker is in the desired position.
When using graph frames, left double-click the frame horizontal axis, or right-click over the horizontal axis and select Axis Properties... to bring up the Axis Properties dialog. Select the Show Markers selection box and then set the x-axis values of each marker directly in the input fields provided. Note that it is also possible to directly set the frequency (i.e. 1/Delta) between the two markers.
When using xy plots, right-click over the plot title bar and select Plot Frame Properties... to bring up the Plot Frame Properties dialog. Select the Show Markers selection box and then set the time-axis values of each marker directly in the input fields provided.
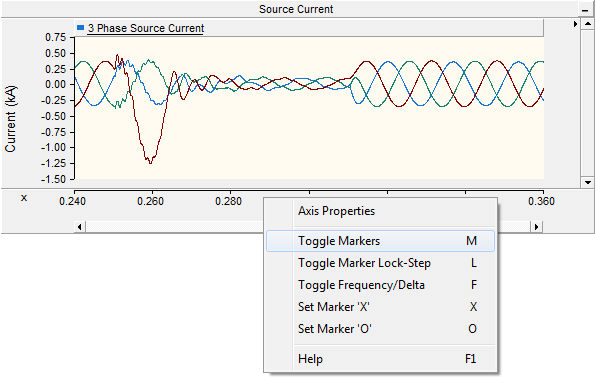
Once the markers are enabled, you can conveniently invert the time axis difference between them to display corresponding frequency. Left double-click the graph frame horizontal axis, or right-click over the horizontal axis and select Toggle Frequency/Delta (or press the F key on your keyboard):
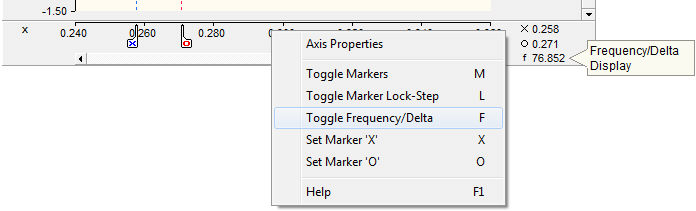
This feature is not available in xy plots.
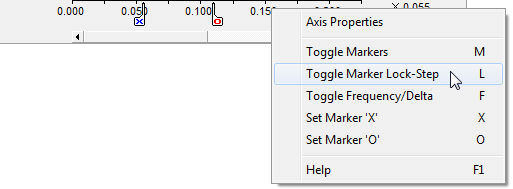
Locking will force the two markers to maintain a constant distance between each other when they are moved along the x-axis. Left double-click the graph frame horizontal axis to bring up the Axis Properties dialog and select Lock Markers, or right-click over the horizontal axis and select Toggle Marker Lock-Step (or press the L key on your keyboard) to lock the markers. Perform the same operation again to unlock.
|
|
Axis Properties Dialog |
Right-Click Menu |
Markers can be set to a certain position on the graph frame time axis as follows:
Show the markers by pressing the M key.
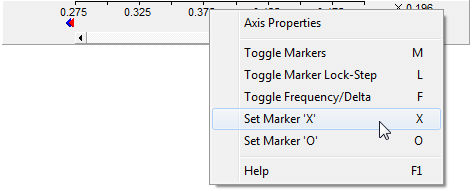
Left-click on the axis at the approximate position where you wish to place the X marker. Press the X key on your keyboard.
Repeat this procedure to set the O marker, except press the O key.
|
|
|
Press the M Key |
Press the X Key |
Press the O Key |
Instead of pressing the above keys, you can also use the time axis pop-up menu. Left-click on the graph frame time axis at the approximate position where you wish to place a marker, then select the appropriate menu function.
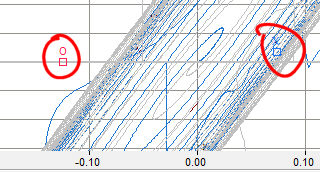
If only a fraction of the total graph frame time scale is currently being viewed in a graph, the markers may appear outside the viewing frame when they are first enabled. If this happens, blue and red arrow symbols will appear on the time axis indicating the markers are set off the screen.
The current viewing window can be moved directly to the position of either marker: Simply left-click either the blue or the red arrow (blue for the X marker and red for the O marker). This functionality, along with setting the markers, can be used to 'bookmark' viewing positions on the graph.