Moving and Resizing a Graph Frame
A Graph Frame is a special runtime object container used for encapsulating Overlay or PolyGraphs, and can be placed anywhere on the Schematic canvas. Once a graph frame has been added, you may then proceed to add as many Graphs to it as you wish.
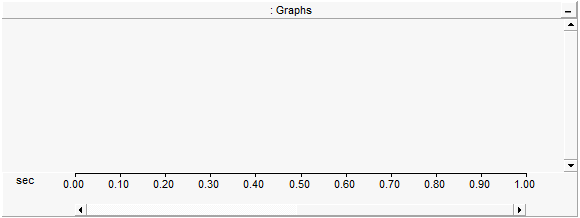
Graph frames are used exclusively for plotting curves versus time. That is, the graph frame horizontal axis is always the simulation time. If you need to a plot a curve as a function of another variable, see XY Plots.
Open the project in Schematic view. Right-click on a blank portion of the page and select Add Component | Graph Frame, or press the Graph Frame button in Components tab of the ribbon control bar.
To move a graph frame, move the mouse pointer over the title bar and then left-click and hold. Drag the frame to where it is to be placed and release the mouse button.
To re-size, move the mouse pointer over the title bar and left-click to select the graph frame. Grips should then appear around the outer edge as shown below.
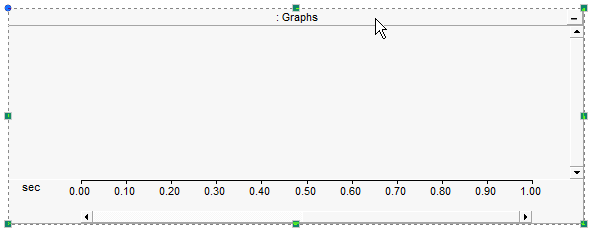
Move the mouse pointer over one of the grips. Left-click and hold and then drag then move the pointer to re-size.
Right-click over the graph frame title bar and select Cut Frame or Copy Frame respectively. Once a graph frame has been cut or copied it may then be pasted into another location in the project (along with its contents).
Cut or copy a graph frame as described above. Right-click over a blank area of the project page in Schematic view and select Paste. A graph frame may be pasted multiple times.
To access the Graph Frame Properties dialog, left double-click the frame title bar, or right-click over the title bar and select Edit Properties....
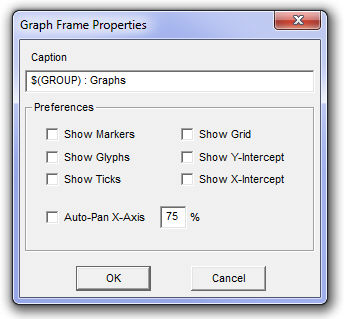
The properties available in this dialog are as described below:
Caption: Enter a title for the graph frame (this text will appear in the graph frame title bar). The default text may appear a bit cryptic: The $(GROUP) syntax is used as a naming convention for grouping objects in the workspace. For more information on this syntax, see Grouping of Runtime Objects. The $(INSTANCE) syntax may be used to display the module name and instance number for ease in transferring to reports.
Preferences:
Show Markers: Select this option to show the X and O markers on all graphs.
Show Glyphs: Select this option to show glyph symbols on all curves in the frame.
Show Ticks: Select this option to show ticks along the y-intercept on all graphs.
Show Grid: Select this option to show the grid on all graphs.
Show Y-Intercept: Select this option to show the y-intercept in all graphs.
Show X-Intercept: Select this option to show the x-intercept in all graphs.
Auto-Pan X-Axis: This allows the user to adjust the panning action. The input field directly beside this check box accepts an input representing the percentage of the currently viewed graph window (or aperture). For example, if the total x-axis view is 0.1 seconds, a 10% auto-pan setting will pan the viewing window every 0.01 seconds.
To access the Horizontal Axis Properties dialog, double-click over the graph frame horizontal axis, or right-click over the horizontal axis and select Axis Properties....
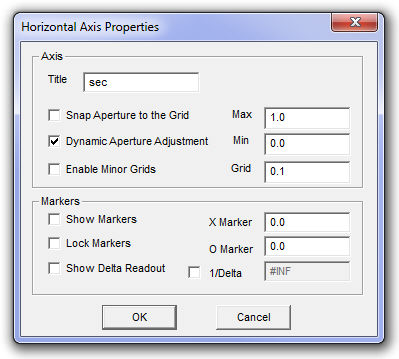
NOTE: Adjusting the horizontal axis properties will affect all graphs in the frame.
Axis:
Title: Enter a title for the x-axis. This text will appear in the bottom-left corner of the frame, directly beside the x-axis.
Snap Aperture to Grid: Select this feature so that when using dynamic aperture adjustment, the aperture view will snap to the major grid while scrolling.
Dynamic Aperture Adjustment: Select this option to enable dynamic aperture adjustment (i.e. horizontal scroll).
Enable Minor Grids: When selected, minor grid ticks will appear on the frame horizontal axis. Minor grids will always show the halfway point between major grid points, and are not labelled.
Max: Sets the maximum time of the viewed range.
Min: Sets the minimum time of the viewed range.
Grid: Sets the time between the axis major grid points. Major grid points are labelled on the graph frame horizontal axis.
Markers:
Show Markers: Select this option to show the X and O markers.
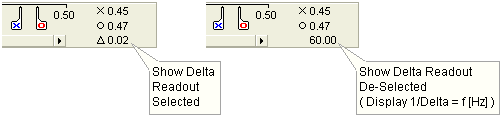
Show Delta Readout: Select this option to display the time difference (i.e. Dt) between the X and O markers. When this option is disabled, the equivalent 1/Dt value (i.e. frequency in Hz) will be displayed.
X Marker: Enter the position (in seconds) to place X marker.
O Marker: Enter the position (in seconds) to place O marker.
1/Delta: Select this option to enter the frequency (i.e. 1/Delta) between markers.