Moving and Re-Sizing an FFT Graph Frame
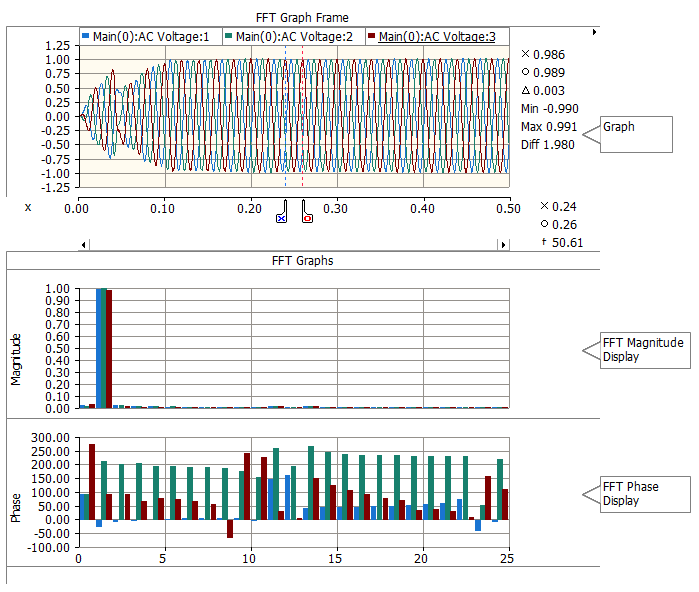
An FFT Graph Frame is a special plotting tool, which consists of a graph frame, a graph, as well as inherent Fast Fourier Transform (FFT) magnitude and phase displays. The graph may hold and display multiple curves, where all curves in a graph are based on the same y-axis scale. Markers are used to identify the start and end points for the FFT calculation. Recalculation is dynamic, and occurs when ever the markers are moved or reset.
The following illustrates an FFT graph frame with an overlay graph at the top and FFT displays below:
Right-click on a blank portion of the Canvas pane and select Add Component | FFT Graph Frame, or press the FFT Graph Frame button in Components tab of the ribbon control bar.
To move an FFT graph frame, move the mouse pointer over the title bar and then left-click and hold. Drag the frame to where it is to be placed and release the mouse button.
To re-size, move the mouse pointer over the title bar and left-click to select the frame. Grips should then appear around the outer edge as shown below.
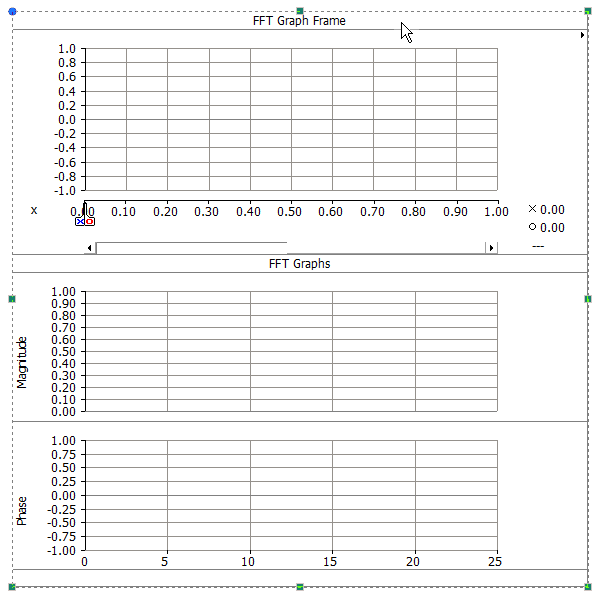
Move the mouse pointer over one of the grips. Left-click and hold and then drag then move the pointer to re-size.
Right-click over the frame title bar and select Cut Frame or Copy Frame respectively. Once a graph frame has been cut or copied it may then be pasted into another location in the project (along with its contents).
Cut or copy a graph frame as described above. Right-click over a blank area of the Canvas pane and select Paste. A graph frame may be pasted multiple times.
To access the FFT Graph Frame Properties dialog, left double-click the frame title bar, or right-click over the title bar and select Edit Properties.... The FFT frame properties are identical to that of the standard graph frame. See Graph Frames for details.