The canvas pane is the most important part of the application environment. It is where the graphical representation of the data is displayed. Once a book, sheet and dataset have been loaded into the Workspace pane, the data may be displayed within graphing components in the canvas.
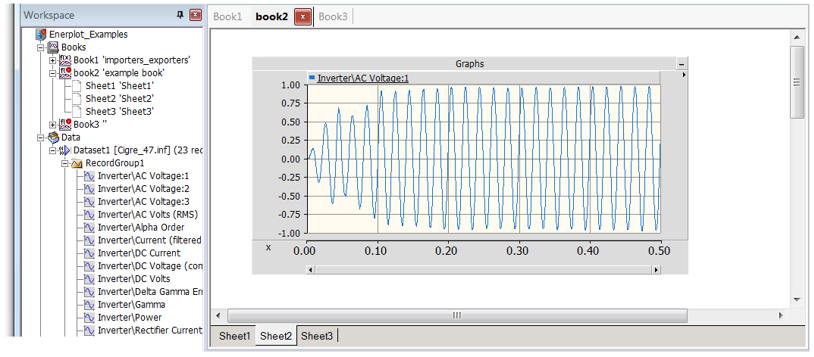
If multiple books have been loaded, the desired book may be selected by a left mouse click on the book in the Workspace pane, or by a left mouse click on the associated navigation tab at the top of the canvas. The order of the books listed in the navigation tabs may be modified by left mouse drag action; this does not affect the order of the books listed in the Workspace pane.
If multiple sheets have been loaded, the desired sheet may be displayed by a left mouse click on the sheet in the Workspace pane, or by a left mouse click on the associated navigation tab at the bottom of the canvas.
A record may be graphically displayed in the canvas once a sheet has been selected per the above paragraph by holding the Ctrl key and using left mouse drag and drop.
See also Editing Sheet Properties for details on adjusting properties of this pane.