If you are using one of the supported, commercial Fortran compilers, then it is possible to utilize the integrated debugger application included with the respective compiler. The following sections describe how to preset relevant project settings, as well as step-by-step instructions on how to link EMTDC with your debugger.
If you are using the free GFortran compiler supplied with PSCAD, there are debugging tools available. See http://sources.redhat.com/insight/index.php.
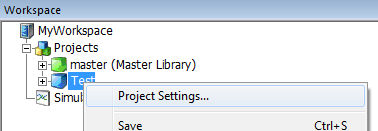
There are a few project settings that must be preset before attempting to proceed – all of which are set in the Project Settings dialog. See Editing Project Settings for details.
In the Runtime section of the dialog, enable the Start simulation manually to allow use of integrated debugger option. Enabling this option allows EMTDC to be started manually.
Next, navigate to the Fortran section of the dialog and enable the Enable addition of runtime debugging information option in the Runtime Debugging area.
Ensure that any required user source files are referenced in the Additional Source files (*.f, *.for, *.f90, *.c, *.cpp) field as well. If you fail to do this, your source files will not be included when the project is compiled, and you will not be able to debug your code.
The following procedure outlines how to set-up an integrated debugging session for your case project. Note that the following steps are described using the Intel Fortran 10 compiler (steps for the Compaq Visual Fortran 6 compiler environment are virtually identical).
Ensure that the project settings described above in Project Options to Preset are enabled. Run the simulation. A pop-up message should appear as follows:
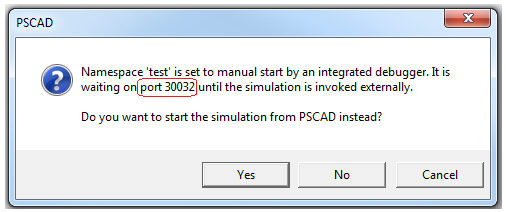
Write down the port number on a piece of paper (you will need it in step 4). If you forget to write down the port number, it is also visible at the bottom left corner of the application window.

Select the No button to continue with debugging.
Open Visual Studio and select File | Open | Project/Solution (for CVF: File | Open).
Change the Objects of Type drop list to Executable Files (*.exe).
Navigate to the PSCAD Temporary Folder associated with your project file, select the executable file (*.exe) for your project and then click the Open button. For example, if your project is entitled 'test.pscx', then you would select 'test.exe' from the temporary folder as shown below:

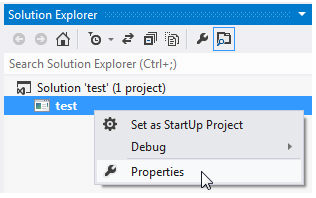
While still in Visual Studio, select Project | Properties... (CVF: Project | Settings...) to bring up the Properties dialog.
Click the Debugging branch (CVF: Debug tab) and in the Arguments field, enter the following:
-v4 localhost ####
Note that the number (represented by #### above) must be the same as that in Step 1. Click the OK button.
While still in Visual Studio, open the appropriate Fortran source file (*.f) by selecting File | Open | File.... Navigate to and then open a Fortran file generated by PSCAD (ex. Main.f).
Insert a breakpoint at the point where your subroutine is called in the source code and press the Start Debugging button. Manually step in to your subroutine. It is important to note that a breakpoint should not be placed directly within your Fortran source file. This is because PSCAD makes a copy of your source file when the executable is built, and so your original Fortran source is not accessed!
Please note that it is assumed that the user is familiar with the debugging software and can continue from here.
Once debugging is complete and the code is clean, make sure that all debugging options outlined in the Project Options to Preset section are disabled. Failure to do so may affect simulation speed.