Adjusting and Controlling the Aperture in XY Plots
The Dynamic Aperture Adjustment feature is available on both the graph frame and the xy plot and allows the user to define a fixed time based display window (or aperture), and then dynamically slide this aperture through the entire time scale. The aperture size itself can be re-adjusted at any time.
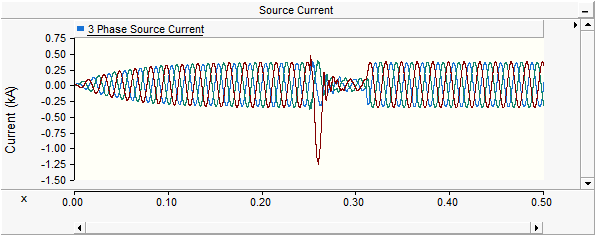
Although the following example uses a graph frame, it may be easily applied to the xy plot as well. Run the simulation so that your graph displays the curve data. The following image shows a simulation that has been run for 0.5 s.

As can be seen from the graph, the fault occurs around 0.25 s and lasts for about 0.07 s. Dynamic aperture adjustment can be used to close the viewing window to a smaller time width, so that the fault waveforms can be more easily studied. To do this, move your mouse pointer over the horizontal scroll bar at the far right so that the mouse pointer turns into a double-headed arrow.

Click and hold the left mouse button and drag the scroll bar aperture slowly to the left.

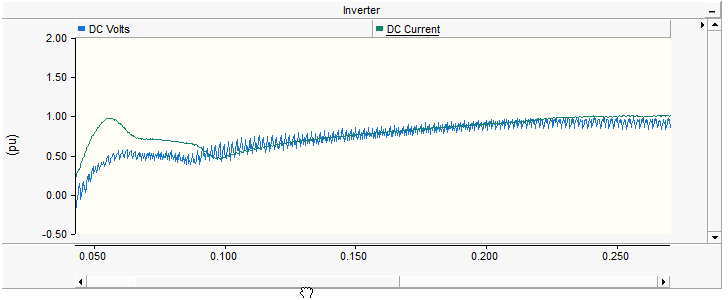
You should see your graph display dynamically adjusting as you change the size of the scroll bar aperture. Keeping an eye on the horizontal axis display, shrink the aperture to an appropriate size (for the graph above, about 0.05 s or so).

Release the left mouse button and move the pointer over the scroll bar aperture, click and hold the left mouse button again – the mouse pointer should become a ‘hand’. Drag the mouse so as to scroll across the time frame of the graph.

If desired, you can shrink the aperture further for even more detail. An aperture will also be created automatically when you zoom into a certain data range.
You may also use either the left and right arrow buttons at each end of the scroll bar, or the arrow keys on your keyboard to scroll through data: To scroll in small increments, simply left-click the either arrow, for larger increments hold down the Ctrl key and then left-click. When using the arrow keys, make sure that the focus is on the graph frame being viewed, as these keys can also function as a scroll mechanism for the Circuit canvas.
NOTE: This exercise is for the purpose of describing dynamic aperture adjustment. A more efficient way to zoom into this aperture window is to use horizontal zoom.
As mentioned previously, the user is able to set and control the time viewing window for the xy plot. At the bottom of the xy plot frame, there is an area devoted solely for the adjustment and control of this viewing window - otherwise known as the aperture.

This area contains two sections: The dynamic aperture adjustment scroll bar on the left, and the manual aperture adjustment field on the right. You can increment the aperture width manually by pressing the up/down arrows to the right of the manual aperture adjustment field.

If the aperture Width is a fraction of the total time scale for the plot, then the aperture indicator scroll bar will reflect this by showing a smaller aperture window:

You may now move the aperture window along the time axis, maintaining its set width. To do this, move your mouse pointer over the aperture indicator in the scroll bar and left-click and hold. Your mouse pointer should become a ‘hand’ symbol. Move the mouse left or right along the axis.

The aperture Position indicator at the bottom-right corner will indicate the starting time of the aperture.