There are several ways to zoom in and out of the data displayed. The following are some of the more common methods.
Select the desired graph with a left-click on the graph display area. Right-click over the graph to generate a pop-up menu and select Zoom | Zoom In or Zoom | Zoom Out. As an alternative, you can also use the + or - keyboard shortcuts for Zoom In or Zoom Out respectively (once the desired graph has been selected).
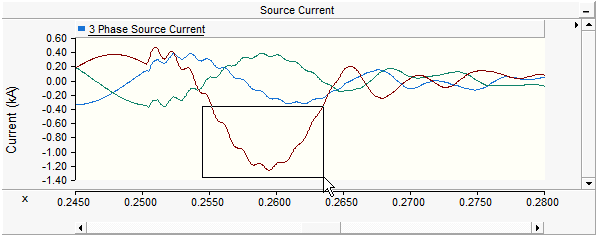
Select the desired graph with a left-click on the graph display area. Click and hold the left mouse button and drag the mouse pointer to create a boxed region. Release the left mouse button to zoom to that region.

NOTE: You can also zoom along a single axis by drawing out a narrow box. The zoom will ignore the narrow side of the box.
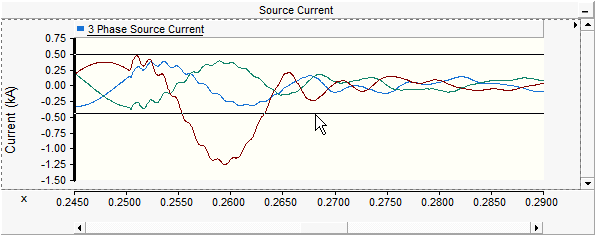
Select the desired graph with a left-click on the graph display area. Press Shift + left mouse hold and drag the mouse pointer in a vertical direction (i.e. up or down along the y-axis) to create a vertical zoom region. Release the left mouse button to zoom to that region.

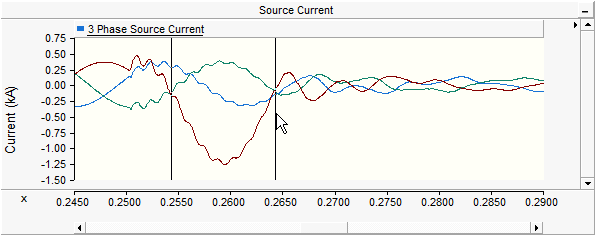
Select the desired graph with a left-click on the graph display area. Press Ctrl + left mouse hold and drag the mouse pointer in a horizontal direction (i.e. left or right along the x-axis) to create a horizontal zoom region. Release the left mouse button to zoom to that region.

Select the desired graph with a left-click on the graph display area. Right-click over the graph to generate a pop-up menu and select Zoom | Previous or Zoom | Next. As an alternative, you can also use the P or N keyboard shortcuts for Zoom Previous or Zoom Next respectively (once the desired graph has been selected).
The Zoom Extents feature allows the user to zoom to the extents of the plotted data.
Select the desired graph with a left-click on the graph display area. Right-click over the graph to generate a pop-up menu and select either Zoom | X Extents or Zoom | Y Extents.
As an alternative, you can also use the X or Y keyboard shortcuts for Zoom X Extents or Zoom Y Extents respectively (once the desired graph has been selected).
Select the desired graph with a left-click on the graph display area. Right-click over the graph to generate a pop-up menu and select either Zoom | Reset All Extents or Zoom | Reset All Limits.
As an alternative, you can also use the R or B keyboard shortcuts for Reset All Extents or Reset All Limits respectively (once the desired graph has been selected).
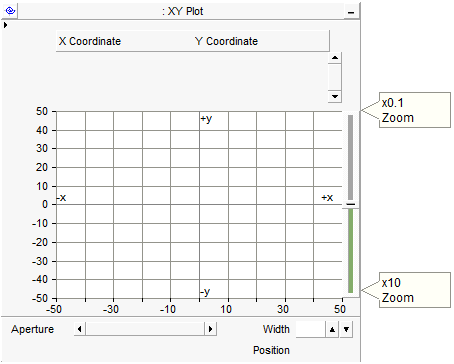
Dynamic zoom is a feature specific to the xy plots. Left click and hold with your mouse pointer over the dynamic zoom control bar as shown below:

With a left click, your mouse pointer should become an open ‘hand’. Hold down the left mouse button and move the hand down to zoom in, or up to zoom out.