Moving and Re-sizing a PolyMeter
Copy PolyMeter as Meta-File/Bitmap
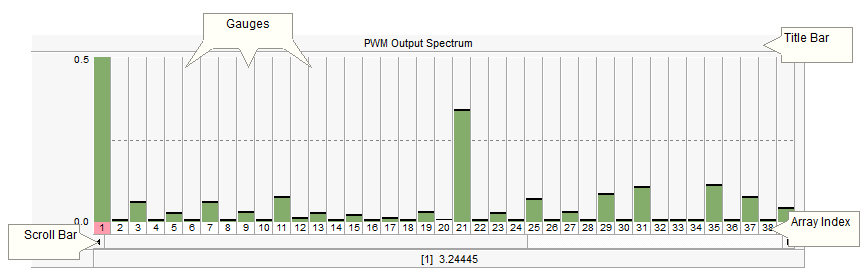
A polymeter is a special runtime object used specifically for monitoring a single, multiple-trace curve. The polymeter dynamically displays the magnitude of each trace in bar type format (called gauges), which results in an overall appearance similar to a spectrum analyzer. The power of this device lies in its ability to compress a large amount of data into a small viewing area, which is particularly helpful when viewing harmonic spectrums such as data output from the Fast Fourier Transform (FFT) component.
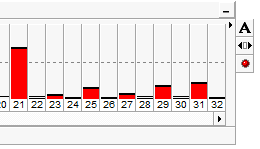
The relative gauge width is fixed, and so if the poly meter is not wide enough to display all data, a simple horizontal scroll bar is provided. An array Index display is included directly under the gauges for easy identification.
Polymeters are special objects that cannot be added directly from the tool bar. Each polymeter is linked with a single curve from a single Output Channel component.
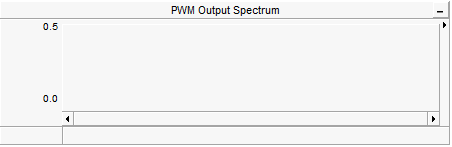
NOTE: Polymeters will appear as a blank container (as shown below) until the project is compiled and run.
To add a polymeter, right-click on an Output Channel component within the Schematic canvas and select Graphs/Meters/Controls | Add as PolyMeter. The polymeter will appear attached to the mouse pointer. Move the pointer to wherever you wish the new meter to reside and then left-click to place it on the Schematic canvas.
To move a polymeter, move the mouse pointer over the title bar and then left-click and hold. Drag the meter to where it is to be placed and release the mouse button.
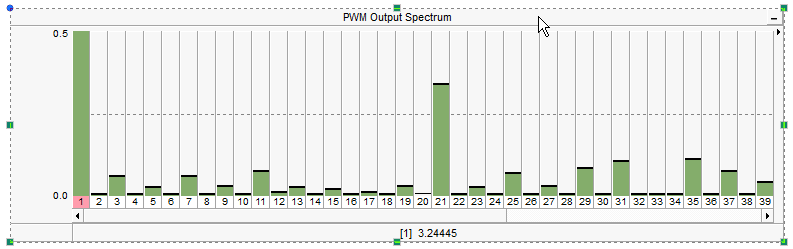
To re-size, move the mouse pointer over the title bar and left-click to select the polymeter. Grips should then appear around the outer edge as shown below.
The polymeter will appear attached to the mouse pointer. Move the pointer to wherever you wish the new meter to reside and then left-click to place it on the Schematic canvas.
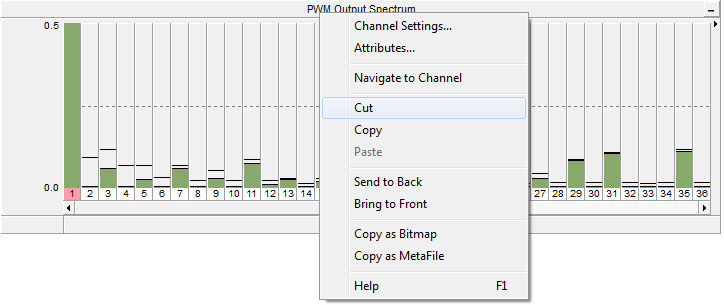
Right-click over the polymeter title bar and select Cut or Copy respectively.
Once a polymeter has been cut or copied it may then be pasted to another any Schematic canvas in the project.
Cut or copy a polymeter as described above. Right-click over a blank area in Schematic view and select Paste. A polymeter may be pasted multiple times.
The entire polymeter display can be copied to the Windows clipboard in either meta-file (*.wmf) or bitmap (*.bmp) format. Right-click over the polymeter title bar and select Copy as Bitmap or Copy as Meta-File. Go to your report document and paste the image.
You can navigate directly to the associated Output Channel component by selecting this option. Right-click over the polymeter and select Navigate to Channel. PSCAD will automatically find the output channel and highlight it.
The y-axis properties of the polymeter are set in the corresponding Output Channel properties dialog. This dialog may be accessed directly from the polymeter by right-clicking over the title bar and selecting Channel properties....
The magnitude of individual array elements can be displayed in the status bar at the bottom of the polymeter. To view the magnitude of that element, left-click on a particular index number in the array index.

You can modify the gauge colour of any polymeter by simply clicking the panel legend and selecting Colour: