Moving and Re-sizing a PhasorMeter
Copy PhasorMeter as Meta-File/Bitmap
Adjusting Phase Angle Input Format
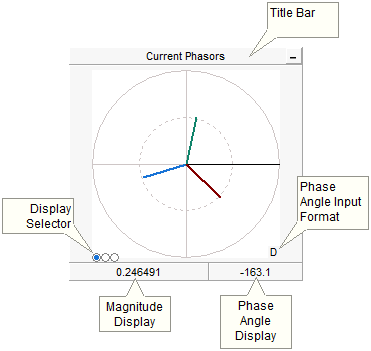
A PhasorMeter is a special runtime object that can be used to display up to six, separate phasor quantities. The phasormeter displays phasors in a polar graph, where the magnitude and phase of each phasor responds dynamically during a simulation run. This device is perfect for visually representing phasor quantities, such as output from the Fast Fourier Transform (FFT) component.

PhasorMeters are special objects that cannot be added directly from the tool bar. Each phasormeter is directly linked with a single curve from a single Output Channel component. In the case of the phasormeter, a curve with at least two traces (magnitude and phase angle) is the minimum requirement for the device to work properly. The following section describes how to prepare data signals for display in the phasormeter.
A single phasor quantity, as it pertains to the phasormeter, is composed of a separate magnitude signal, along with an associated phase angle signal, which combined represents a single phasor quantity in polar format. That is:
![]()
To display a single phasor quantity, the user must construct an array data signal of dimension two, using the Data Merge component. The two data signals will represent the magnitude and phase angle respectively. To this array signal, an Output Channel is attached as shown below:
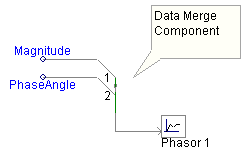
The phasor meter always assumes that the elements of the array are in the above displayed order. That is element 1 is the magnitude and element 2 is the phase angle.
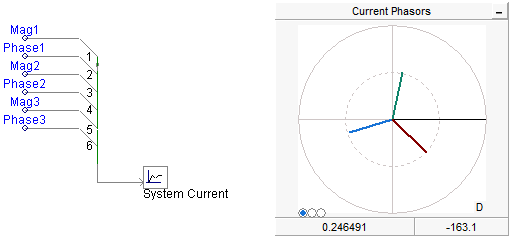
The phasormeter allows up to a maximum of six phasors per display, which corresponds to an input array signal of dimension 12. In cases of multiple phasors, the order of each magnitude/phase angle group must appear in the same order as the first (i.e. magnitude, phase angle, magnitude, phase angle, etc.) as shown below for a three phasor display:
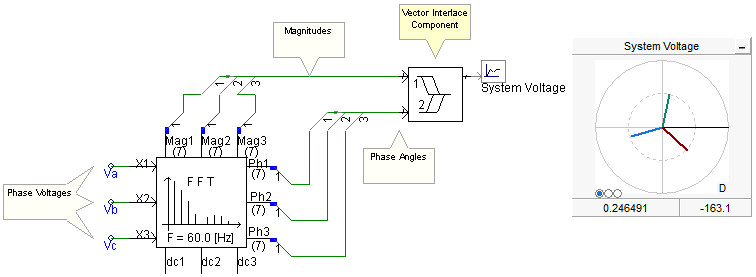
More often than not, the Fast Fourier Transform (FFT) component will be used to derive the polar quantities for display in the phasormeter. If so, a special component, called the Vector Interlace component was developed to make it easier to prepare data for display. The image below illustrates a situation where it could be used:
To add a phasormeter, right-click on an Output Channel component within the Schematic canvas and select Graphs/Meters/Controls | Add as PhasorMeter. The phasormeter will appear attached to the mouse pointer. Move the pointer to wherever you wish the new meter to reside and then left-click to place it on the Schematic canvas.
To move a phasormeter, move the mouse pointer over the title bar and then left-click and hold. Drag the meter to where it is to be placed and release the mouse button.
To re-size, move the mouse pointer over the title bar and left-click to select the meter. Grips should then appear around the outer edge as shown below.
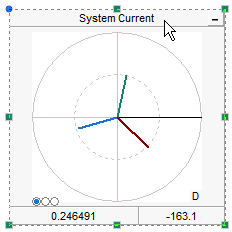
Move the mouse pointer over one of the grips. Left-click, hold and then drag the pointer to re-size.
Right-click over the phasormeter and select Cut or Copy respectively. Once a phasormeter has been cut or copied it may then be pasted to another location in the project.
Cut or copy a phasormeter as described above. Right-click over a blank area of the project page in Schematic view and select Paste. A phasormeter may be pasted multiple times.
The entire phasormeter display can be copied to the Windows clipboard in either meta-file (*.wmf) or bitmap (*.bmp) format. Right-click over the phasormeter title bar and select Copy as Bitmap or Copy as Meta-File. Go to your report document and paste the image.
You can navigate directly to the associated Output Channel component by selecting this option. Right-click over the phasormeter and select Navigate to Channel: PSCAD will automatically find the output channel and highlight it.
The polar axis limits of the phasormeter are set in the corresponding Output Channel properties dialog. This dialog may be accessed directly from the phasor meter by right-clicking over the device title bar and selecting Channel properties....
The magnitude and phase angle of individual array elements can be displayed in the status bar at the bottom of the phasormeter: Left-click the corresponding button on the display selector, where the buttons represent phasors 1 through 6 from left to right.

The format that the incoming phase angle data is in must be specified. This is easily accomplished by toggling the D or R display in the bottom-right corner of the graph, where:
D: Degrees
R: Radians
