The Frequency Dependent (Phase) model is basically a distributed RLC traveling wave model, which incorporates the frequency dependence of all parameters. This model represents the frequency dependence of internal transformation matrices.
For most studies, the default parameters are suitable. The user should always check the log file, as it will show any warnings and errors produced by the line constants program, and will also indicate the final accuracy of the curve fitting process.
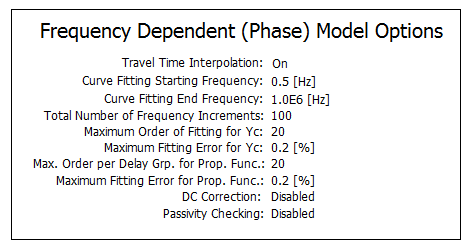
NOTE: The Frequency Dependent (Phase) Model is the most numerically accurate and robust line/cable model available anywhere in the world!
More: |
Practical Guideline to Selecting Curve Fitting Options Curve Fitting Starting and End Frequencies Least Squares Weighting Factor Frequency Dependent Line Models |
Interpolate Travel Times? |
|
Choice |
|
Select Yes or No. When modeling shorter transmission lines, travel times should be interpolated. |
|
|
|
|
|
Output Detailed Output Files? |
|
Choice |
|
Select Yes or No. Select Yes if you wish to view frequency domain output using the Detailed Output Viewer. |
|
|
|
|
|
Do You Want this to be a Reflection-less Line (i.e. Infinite Length)? |
|
Choice |
|
Select Yes or No. If enabled, the transmission line will be considered reflection-less, or of infinite length.
The reflection-less line model option is used primarily for lightning studies. For such studies, the total duration of the study is a few microseconds, using time steps in the nanosecond range. This is much too short a time for anything to travel down the line and reach the other end, so you can use the above option to disconnect the travelling waves from reaching the other end.
This means that all that is left is the frequency-dependent surge impedance at each end of the line, which will determine the currents/voltages due to disturbances at each end of the line due to lightning impulses. Quite often many users delete lines all-together and replace them by 300 W resistors to ground (or the high frequency surge impedance of the line). |
See Practical Guideline to Selecting Curve Fitting Options for more on these parameters.
Lower Limit |
|
REAL |
Literal |
Select a curve fitting starting frequency. See Curve Fitting Starting and End Frequencies for details [Hz] |
|
|
|
|
|
Upper Limit |
|
REAL |
Literal |
Select a curve fitting end frequency. See Curve Fitting Starting and End Frequencies for details [Hz] |
|
|
|
|
|
Total Solution Increments |
|
Choice |
|
Select 100, 200, 500 or 1000.
This is the total number of calculation steps between the Lower Frequency Limit and the Upper Frequency Limit. Although an increased number of frequency steps will usually allow for a better curve fit of parameters, it may sometimes be better to use less steps. The default of 100 is usually a good choice. |
|
|
|
|
|
Maximum Poles per Column |
|
INTEGER |
Literal |
Enter the maximum number of poles per column for characteristic (surge) admittance.
The maximum number of poles can be set if a low order curve-fitted approximation is required. Normally the Transmission Line and Cable Constants program will iterate and will continuously increase the order of the curve-fitted waveforms until the error is below the Maximum Final Fitting Error (Yc) (see below). However for real-time applications, there may be only enough time to calculate a lower-order approximation for the line equations, so this parameter can be set. Generally this can be left at 20. |
|
|
|
|
|
Maximum Final Fitting Error (Yc) |
|
REAL |
Literal |
Enter the maximum fitting error for characteristic (surge) admittance [%].
The Transmission Line and Cable Constants program will incrementally increase the number of poles of the approximation to fit the characteristic admittance until this error criterion is met. However, the resulting number of poles is not allowed to exceed the specified Maximum Poles per Column. Specifying a high value here will lead to a lower order approximation and thus a faster simulation. However, beware that excessive fitting errors can lead to unstable simulations. |
|
|
|
|
|
Least Squares Weighting Factors |
|
REAL |
Literal |
Includes 0 to F0, F0 and F0 to Fmax.
Provide weighting factories for the given three frequency ranges. For most cases, the default settings are sufficient. See Least Squares Weighting Factor for details. |
|
|
|
|
|
Maximum Poles per Delay Group |
|
INTEGER |
Literal |
Enter the maximum number of poles per delay group for the propagation function.
As mentioned above in Maximum Poles per Column (for the characteristic admittance), the curve fitting algorithm used in the Transmission Line and Cable Constants program will iterate (increasing the curve fitting order at each iteration) until the desired error is met. If the Maximum Final Fitting Error (H) parameter is too large, then the curve fitting will stop with a relatively low-order approximation. This can result in numerically unstable results and general errors in certain frequency ranges. It is recommended to use 0.2% or lower for these parameters. The log file should always be checked to ensure the entered error criteria is met. |
|
|
|
|
|
Maximum Final Fitting Error (H) |
|
REAL |
Literal |
Enter the maximum fitting error for the propagation function [%]. This parameter is enabled only if Pole Identification Method | Mode Fitting is selected.
The Transmission Line and Cable Constants will incrementally increase the number of poles of the approximation to fit the propagation function until this error criterion is met. However, the resulting number of poles is not allowed to exceed the specified Maximum Poles per Delay Group. Specifying a high value here will lead to a lower order approximation and thus a faster simulation compile. However, beware that excessive fitting errors can lead to unstable simulations. |
|
|
|
|
|
Maximum Residue/Pole Ratio Tolerance |
|
REAL |
Literal |
Enter the maximum tolerance for the residue/pole ratio.
This ratio may be used as an indicator of potential time domain instability. The general rule is that ratios greater than 1000.0 have a better chance of leading to instability. The Transmission Line and Cable Constants program uses a Model Order Reduction algorithm to rid the solution of ratios higher than this tolerance.
See Curve Fitting for more details on this. |
See Passivity Checking for more details on these parameters.
Pasivity Checking Is |
|
Choice |
|
Select Enabled or Disabled.
Toggle this parameter to enable or disable passivity checking. Passivity checking is performed on the curve fitted results, which are in turn derived from the frequency-domain response. |
|
|
|
|
|
Total Frequency Samples |
|
Choice |
|
Select 20, 50, 100 or 500.
Choose the number of frequency samples between the specified lower and upper limits. These samples are exclusive from those used in the actual curve fitting of the results. The total samples should be sufficiently high to avoid the possibility of missed passivity violations between two frequency samples. |
|
|
|
|
|
Lower Frequency Limit |
|
REAL |
Literal |
Lower frequency limit [Hz].
The lower bound of frequency range where passivity violations are searched. Since passivity violations are present at very low frequencies, typical values may be 0.001 Hz, 0.01 Hz, etc. |
|
|
|
|
|
Upper Frequency Limit |
|
REAL |
Literal |
Upper frequency limit [Hz]. |
DC Correction |
|
Choice |
|
Select Enabled or Disabled.
The goal of the DC Correction procedure is to guarantee the exact fitting of the rational function at zero hertz, hence giving the correct DC response for the line. However, take care to monitor the log file for problems with fitting. |
|
|
|
|
|
Correction Method |
|
Choice |
|
Select Functional Form or Add Pole/Residue. See DC Correction for details. |
|
|
|
|
|
Eliminate Error at Very High Frequencies? |
|
Choice |
|
Select Yes or No. This parameter is enabled only if Correction Method | Functional Form is selected.
Although the DC error is eliminated, the resultant propagation function at very large frequencies deviates marginally from zero, which is contrary to the physical properties of typical propagation functions. This error can be eliminated by slightly perturbing residues of the fitted function. It is recommended that this option remain as Yes in order to ensure error at high frequencies is eliminated. |
|
|
|
|
|
Shunt Conductance (for Cables Only) |
|
REAL |
Literal |
Enter a value for shunt conductance (cables only!) [mho/m]. This input is ignored for overhead lines, as it is entered within the tower component.
This value is important in order to obtain a stable time domain simulation (i.e. it improves passivity at low frequencies) and also helps to improve the behaviour of the rational function at low frequencies. The shunt conductance should be a very small value and will not affect the high frequency behaviour of time domain simulations. Typical shunt conductance values should remain in the order of 1e-9 or 1e-10.
See Curve Fitting Starting and End Frequencies for details. |