The Module Comparison Tool provides the ability to compare two module definitions and identify differences through graphical feedback.
The comparison is performed directly on the XML data representing each module definition, and so the differences detected encompass just about everything from parameters, script and graphics of components on the Schematic canvas, to Canvas Settings and other properties. The tool will also detect whether or not components exist in both the primary and secondary module definition being compared.
NOTE: The comparison tool does not identify differences in the module definition graphic or module parameters sections.
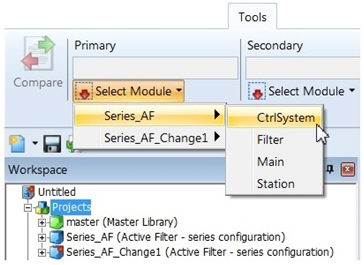
The controls for the module comparison tool may be found in the Tools tab of the ribbon control bar. At least one project must be loaded in the workspace before proceeding. To compare two module definitions:
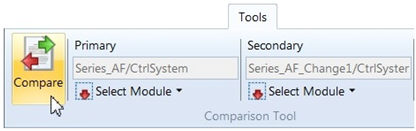
Select the primary and secondary module definitions from the drop lists provided. The drop lists will include access to all module definitions in all projects currently loaded in the workspace. For example, the CtrlSystem module in the project Series_AF and the CtrlSystem module in the project Series_AF_Change1 are selected for comparison below.
Select the Compare button to perform the comparison.
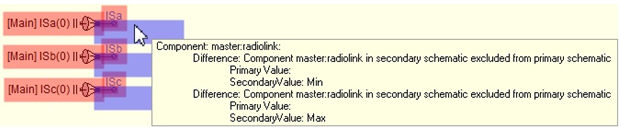
When differences are detected, they are displayed in both the Schematic view and in the Comparison Tool Results pane. In the Schematic view, color-coded shading is applied to areas where differences are detected. For example:
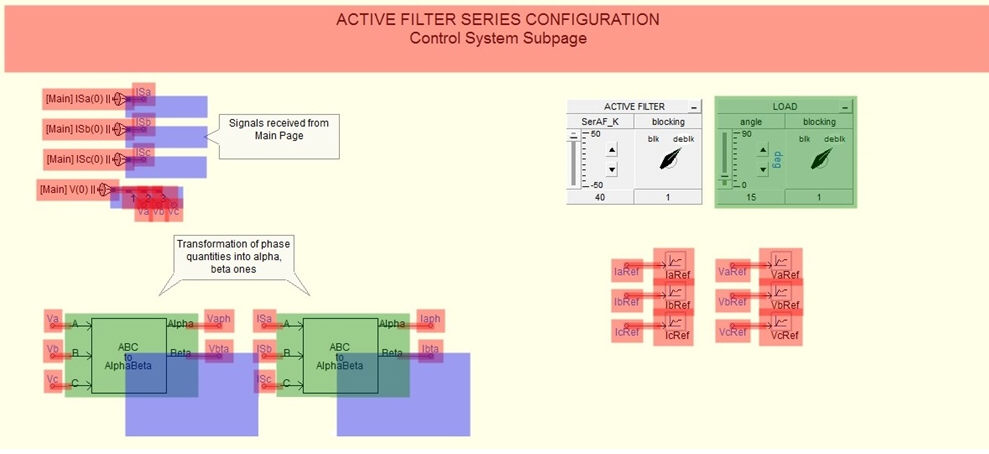
If the mouse pointer is positioned over one of the graphical results on the transparency, a popup dialog will appear, listing the description of the difference.
The comparison results are displayed on a transparency, overlaid atop the actual Schematic canvas. While the transparency is enabled, no changes may be made to the canvas. The comparison transparency may be toggled on and off by clicking the Show/Hide Comparison button in the ribbon control bar (this button may be found in either the Tools or the View tab).

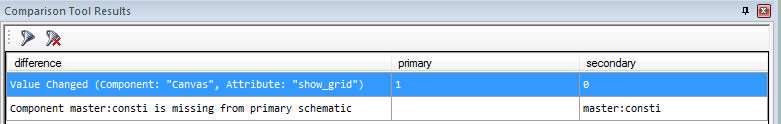
Differences may also be reviewed in table format via the Comparison Tool Results pane. Each row in the table represents a unique difference between the two module definitions, including a description of the difference, as well as the actual values in each module as applicable.
Note that like the other panes, the Comparison Tool Results may be hidden, tabbed or docked in the PSCAD environment, or undocked outside of PSCAD as a separate floating pane.
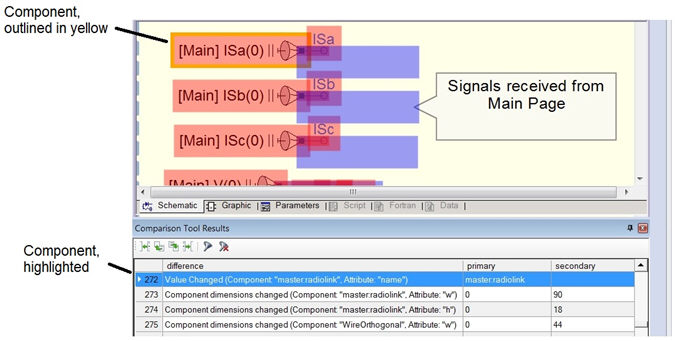
The results shown in the Schematic view are synchronized with those given in the Comparison Tool Results pane. Simply click a row in the results table to highlight the result in the Schematic view. Alternatively, select a difference in Schematic view to highlight the corresponding row in the Comparison Tool Results pane.
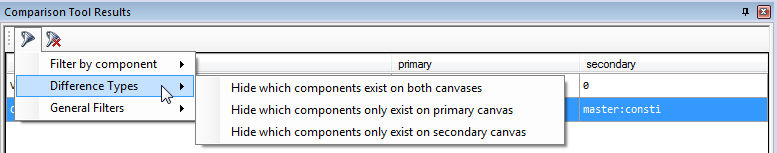
The data in the Comparison Tool Results pane may be filtered in a number of different ways in order to keep the information specific to what you are looking for. To filter the results:
Right-click on a specific row in the results pane and select a filter:
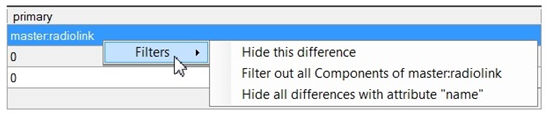
Select a filter from the Filter button: