Current Dependent Current Source
Voltage Dependent Current Source
Voltage Dependent Voltage Source
The following illustrate how the various dependent sources are used in a practical application.
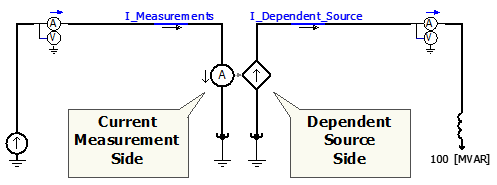
The objective of this example is to demonstrate the functionality of the current dependent current source model in the PSCAD master library. Figure 1 depicts the overview of the example circuity, and Figure 2 depicts the configuration of the current dependent current source. The current dependent current source has two sides (i.e. current measurement side and dependent source side). In this specific example, the three-phase currents are measured on the current measurement side. The dependent source injects currents based on the measured currents multiplied by a scaling factor of 0.5.
Figure 1: Overview of the example circuity for current dependent current source
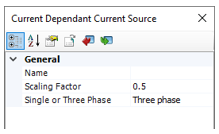
Figure 2: Configuration of the current dependent current source in the example case
Figure 3 shows the current waveforms at the current measurement side and the current waveforms at the dependent source side. Phase A of the current waveforms was bolded at the current measurement side with Black colour and at the dependent source side with Red colour. The currents injected by the dependent current source is half of the measured currents.
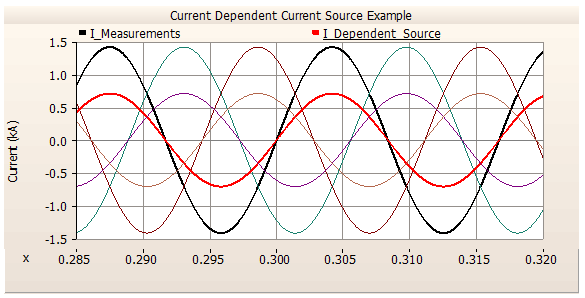
Figure 3: Waveforms from the measurement side and the dependent source side
The objective of this example is to demonstrate the functionality of the voltage dependent current source model in the PSCAD master library. Figure 4 depicts the overview of the example circuity, and Figure 5 depicts the configuration of the voltage dependent current source. The voltage dependent current source has two sides (i.e. voltage measurement side and dependent source side). In this specific example, the three-phase voltages are measured on the voltage measurement side. The dependent source injects currents based on the measured voltages multiplied by a scaling factor of 0.5.
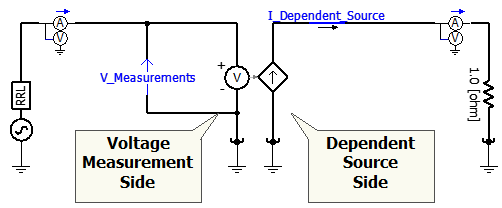
Figure 4: Overview of the example circuity for voltage dependent current source
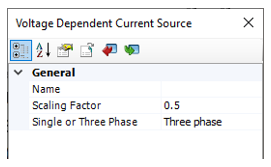
Figure 5: Configuration of the voltage dependent current source in the example case
Figure 6 shows the voltage waveforms across the voltage measurement side and the current waveforms on the dependent source side. Phase A of the measured voltages waveform was bolded with Black colour. Phase A of the injected current waveforms was bolded at the dependent source side with Red colour. The magnitude of the currents injected by the dependent current source is half of the magnitude of the measured voltages.
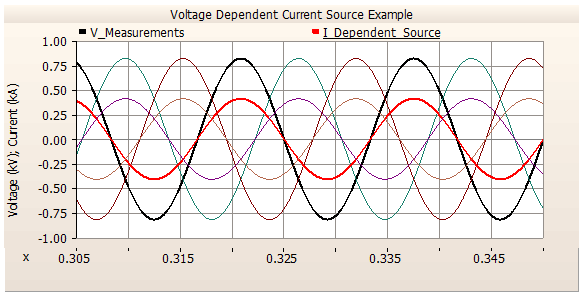
Figure 6: Waveforms from the measurement side and the dependent current source side
The objective of this example is to demonstrate the functionality of the voltage dependent voltage source model in the PSCAD master library. Figure 7 depicts the overview of the example circuity, and Figure 8 depicts the configuration of the voltage dependent voltage source. The voltage dependent voltage source has two sides (i.e. voltage measurement side and dependent source side). In this specific example, the three-phase voltages are measured on the voltage measurement side. The dependent source forms the voltages across its terminals based on the measured voltages multiplied by a scaling factor of 0.5.
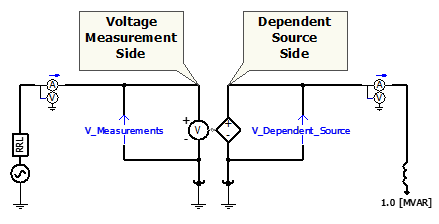
Figure 7: Overview of the example circuity for voltage dependent voltage source
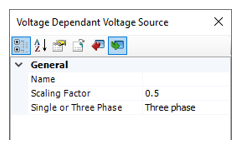
Figure 8: Configuration of the voltage dependent voltage source in the example case
Figure 9 shows the voltage waveforms across the voltage measurement side and the voltage waveforms across the dependent source side. Phase A of the voltage waveforms was bolded at the voltage measurement side with Black colour and at the dependent source side with Red colour. The voltages formed by the dependent voltage source is half of the measured voltages.
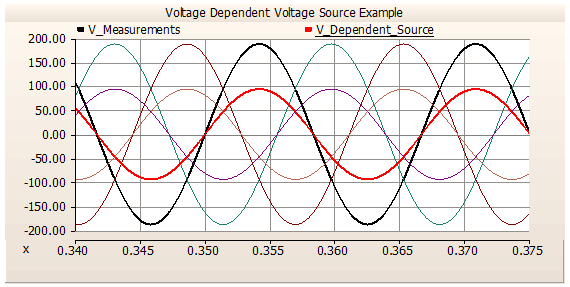
Figure 9: Waveforms from the measurement side and the dependent voltage source side
The objective of this example is to demonstrate the functionality of the ideal ratio changer in the PSCAD master library. Figure 10 depicts the overview of the example circuity, and Figure 11 depicts the configuration of the Ideal Ratio Changer component. In this example, the three-phase voltages are measured across the dependent current source on the left hand side, while the three-phase currents through the dependent voltage source are measurement on the right hand side. The dependent voltage source forms the voltages across its terminals based on the measured voltages multiplied by a scaling factor of 0.5. The dependent current source injects the currents based on the measured currents multiplied by a scaling factor of 0.5.
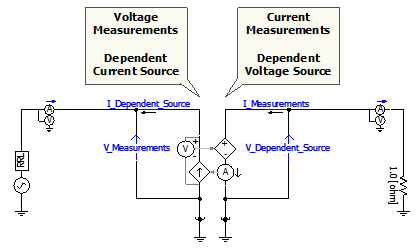
Figure 10: Overview of the example circuity for Ideal Ratio Changer Component
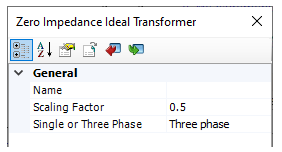
Figure 11: Configuration of the Ideal Ratio Changer Component in the example case
The top waveforms in Figure 12 show the measured voltages across the dependent current source and the formed voltage waveforms across the dependent voltage source. The bottom waveforms show the measured currents through the dependent voltage source and the currents injected by the dependent current source.
Phase A of the measured voltage waveforms across the dependent current source and phase A of the measured current waveforms through the dependent voltage source were bolded with black colour. Phase A of the voltage waveforms across the dependent voltage source and phase A of the current waveforms injected by the dependent current source were bolded with red colour.
The voltages formed by the dependent voltage source are half of the measured voltages. The currents injected by the dependent current source are half of the measured currents.
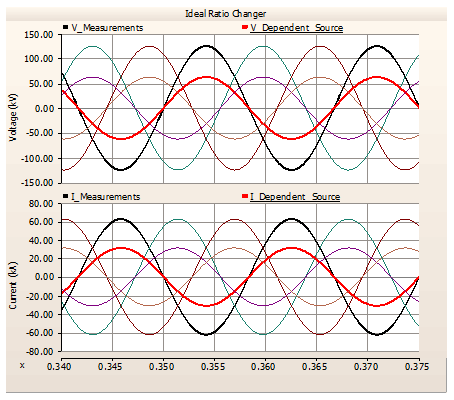
Figure 12: Waveforms from the Ideal Ratio Changer example simulation