Tutorial#
Setup#
Use py -m pip install mhi.psout to install the PSOut reader module.
The following examples use this Cigre.psout file.
Opening a file#
To ensure the file is properly closed and resources are released,
a with statement should be used to open the file.
import mhi.psout

with mhi.psout.File('Cigre.psout') as file:
    print(f"{file.path} was created {file.created}, modified {file.modified}.")
    print(f"It contains {file.num_runs} runs.")
Cigre.psout was created 2022-06-21 16:06:07, modified 2022-06-21 16:06:08.
It contains 1 runs.
Finding a Call#
The call tree begins with the File.root node.
Each node may have subcall nodes, which in turn may have additional subnodes.
The .calls() method may be used to iterate over the subcalls.
import mhi.psout

def print_call_tree(node, indent):
    try:
        name = node["Name"]
    except KeyError:
        name = "-Unnamed-"

    indent += "  "
    print(f"{indent}{node.id}: {name}")
    for subnode in node.calls():
        print_call_tree(subnode, indent)

with mhi.psout.File('Cigre.psout') as file:
    print(f"{file.path} was created {file.created}, modified {file.modified}.")
    print(f"It contains {file.num_runs} runs.")

    print("Call Tree:")
    print_call_tree(file.root, "")
Cigre.psout was created 2022-06-21 16:06:07, modified 2022-06-21 16:06:08.
It contains 1 runs.
Call Tree:
  0: -Unnamed-
    0: Root
      1521188156: Main
        24084624: AC Voltage
          0: Record
            1: PGB:Data
            2: PGB:Data
            3: PGB:Data
        24086976: AC Volts (RMS)
          0: Record
            1: PGB:Data
        24090824: AC Voltage
          0: Record
            1: PGB:Data
            2: PGB:Data
            3: PGB:Data
⋮   ⋮   ⋮   ⋮   ⋮   ⋮   ⋮   ⋮
Beneath the File.root node (the only node which does not have a "Name"),
PSCAD created a node called "Root".
Underneath that node, a call for the "Main" canvas was created.
Beneath that, a node was created for the "AC Voltage" PGB data.
The individual nodes for phase A, B and C are nested in an additional "Record" node.
The File.call_tree() method already exists which will print out the
call tree with more detail:
Cigre.psout was created 2022-06-21 16:06:07, modified 2022-06-21 16:06:08.
It contains 1 runs.
Call Tree:
  0
    0 Name='Root', Description='Root', Source='Module'
      1521188156 Name='Main', Description='Main Working Page', Source='Module'
        24084624 Name='AC Voltage', Description='Output Channel', Source='PGB'
          0 Name='Record', Description='', Source='Data'
            1 Name='PGB:Data', Description='AC Voltage:PGB:Trace:1', Source='Trace'
            2 Name='PGB:Data', Description='AC Voltage:PGB:Trace:2', Source='Trace'
            3 Name='PGB:Data', Description='AC Voltage:PGB:Trace:3', Source='Trace'
        24086976 Name='AC Volts (RMS)', Description='Output Channel', Source='PGB'
          0 Name='Record', Description='', Source='Data'
            1 Name='PGB:Data', Description='AC Volts (RMS):PGB:Trace:1', Source='Trace'
        24090824 Name='AC Voltage', Description='Output Channel', Source='PGB'
          0 Name='Record', Description='', Source='Data'
            1 Name='PGB:Data', Description='AC Voltage:PGB:Trace:1', Source='Trace'
            2 Name='PGB:Data', Description='AC Voltage:PGB:Trace:2', Source='Trace'
            3 Name='PGB:Data', Description='AC Voltage:PGB:Trace:3', Source='Trace'
⋮   ⋮   ⋮   ⋮   ⋮   ⋮   ⋮   ⋮   ⋮   ⋮   ⋮   ⋮   ⋮   ⋮   ⋮   ⋮   ⋮   ⋮   ⋮   ⋮   ⋮   ⋮   ⋮   ⋮
Getting a Trace#
Traces are stored within individual runs, and a .psout file can store many runs.
To retrieve a trace, we must first fetch the desired run.
Since our file only contains one run, we can simply retrieve the zeroth run.
import mhi.psout

with mhi.psout.File('Cigre.psout') as file:
    print(f"{file.path} was created {file.created}, modified {file.modified}.")
    print(f"It contains {file.num_runs} runs.")

    ac_voltage = file.call("Root/Main/AC Voltage/0")
    print(ac_voltage)

    ph_a = ac_voltage.call(1)
    ph_b = ac_voltage.call(2)
    ph_c = ac_voltage.call(3)
    print(f"  Phase A: {ph_a}")
    print(f"  Phase B: {ph_b}")
    print(f"  Phase C: {ph_c}")
run = file.run(0)
Once we have the run, we simply request the trace for the given call.
a = run.trace(ph_a)
b = run.trace(ph_b)
c = run.trace(ph_c)
print(a.datatype, a.size)
print(b.datatype, b.size)
print(c.datatype, c.size)
The Trace.data attribute contains the trace sample values.
We can display the first few values for each phase:
print("A: ", ", ".join(f"{v:7.4f}" for v in a.data[:8]), "...")
print("B: ", ", ".join(f"{v:7.4f}" for v in b.data[:8]), "...")
print("C: ", ", ".join(f"{v:7.4f}" for v in c.data[:8]), "...")
Cigre.psout was created 2022-06-21 16:06:07, modified 2022-06-21 16:06:08.
It contains 1 runs.
Call[#0, Name='Record', Description='', Source='Data']
  Phase A: Call[#1, Name='PGB:Data', Description='AC Voltage:PGB:Trace:1', Source='Trace']
  Phase B: Call[#2, Name='PGB:Data', Description='AC Voltage:PGB:Trace:2', Source='Trace']
  Phase C: Call[#3, Name='PGB:Data', Description='AC Voltage:PGB:Trace:3', Source='Trace']
<class 'float'> 2001
<class 'float'> 2001
<class 'float'> 2001
A: 0.0000, 0.0000, 0.0001, 0.0002, 0.0006, 0.0011, 0.0021, 0.0034 ...
B: 0.0000, -0.0001, -0.0006, -0.0014, -0.0027, -0.0046, -0.0071, -0.0103 ...
C: 0.0000, 0.0001, 0.0005, 0.0012, 0.0021, 0.0034, 0.0050, 0.0069 ...
Domain#
Samples values are meaningless without corresponding domain values. In this case, the phase values are sampled over time, so the domain for each trace will be the time axis.
The domain is itself a trace, with a datatype and size.
The domain for each trace can be retrieved using the domain attribute.
While each trace may have its own domain, often those domains are shared. In this case, the samples for the phases are all taken at the same moments in time, so they all share the same “time domain”.
    print("All domains are the same?", a.domain == b.domain == c.domain)
    time = a.domain
    print(time.datatype, time.size)
    print("T: ", ", ".join(f"{v:7.5f}" for v in time.data[:8]), "...")
All domains are the same? True
<class 'float'> 2001
T:  0.00000, 0.00025, 0.00050, 0.00075, 0.00100, 0.00125, 0.00150, 0.00175 ...
Note
PSCAD Animations are stored in traces, but since different animations can change appearences at different times, each animation trace will have its own time domain trace, containing only the time moments when the animation state changes.
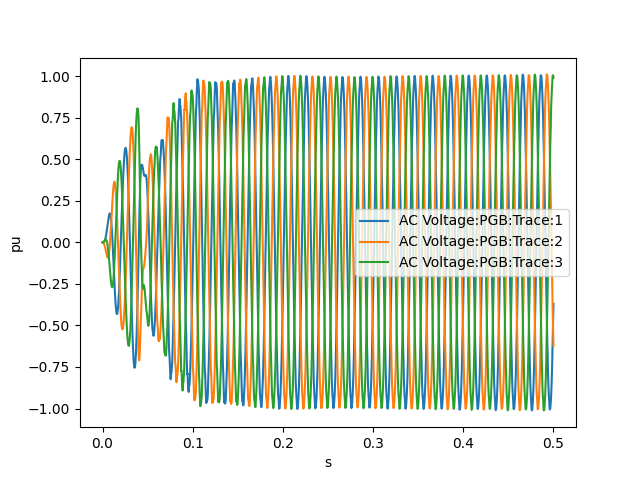
Plotting Data#
With domain and range data, the traces may be directly plotted using
matplotlib or other plotting packages:
import mhi.psout
import matplotlib.pyplot as plt

with mhi.psout.File('Cigre.psout') as file:

    ac_voltage = file.call("Root/Main/AC Voltage/0")
    run = file.run(0)

    for call in ac_voltage.calls():
        trace = run.trace(call)
        time = trace.domain
        plt.plot(time.data, trace.data, label=trace['Description'])

    plt.xlabel(time['Unit'])
    plt.ylabel(trace['Unit'])
    plt.legend()
    plt.savefig('ac_voltage.png')